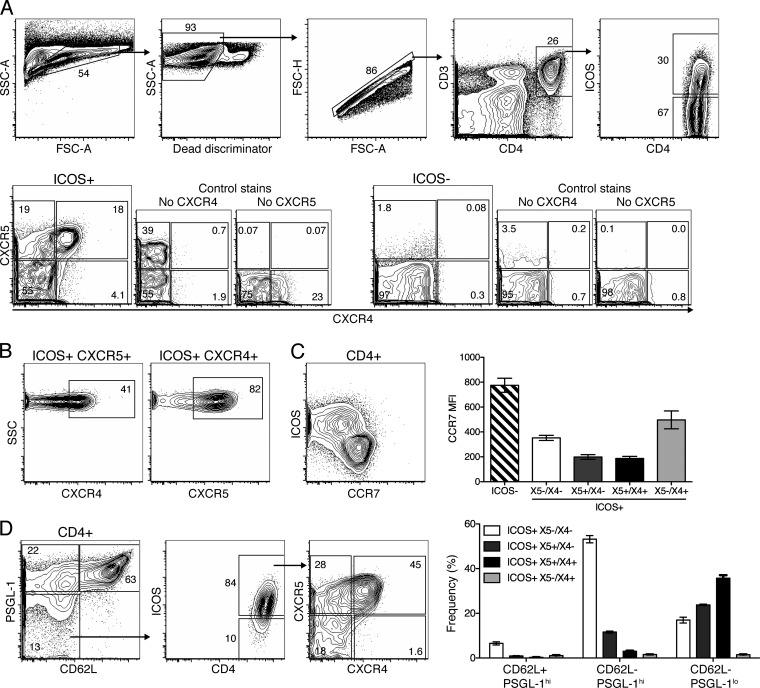
Fig 2.
ICOS+ CXCR5+ TFH coexpressing CXCR4 are induced in response to infection. MedLN isolated from BALB/c mice (n = 4) at 10 days postinfection with influenza virus A/Mem71 were analyzed by 8- to 10-color flow cytometry. Shown are 5% contour plots with outliers of a representative sample from one of at least two repeat experiments (n = 4 each). (A) Gates used to identify CD4+ ICOS+ T cells expressing CXCR5 and/or CXCR4. SSC, side scatter; FSC, forward scatter. (B) CD4+ T cells were further analyzed to display the frequency of ICOS+ CXCR5+ cells coexpressing CXCR4 (left) and ICOS+ CXCR4+ cells coexpressing CXCR5 (right). (C) Expression levels of ICOS and CCR7 were examined on CD4+ T cells (left). The bar chart indicates mean fluorescent intensities (MFI) ± SD for CCR7 on the indicated CD4+ T cell populations. (D) ICOS, CXCR5, and CXCR4 expression levels in CD4+ CD62L− PSGL-1low cells were analyzed. The bar chart represents the mean frequencies ± SD for the four ICOS+ populations identified by CXCR5 and CXCR4 expression among cells indicated on the x axis.

