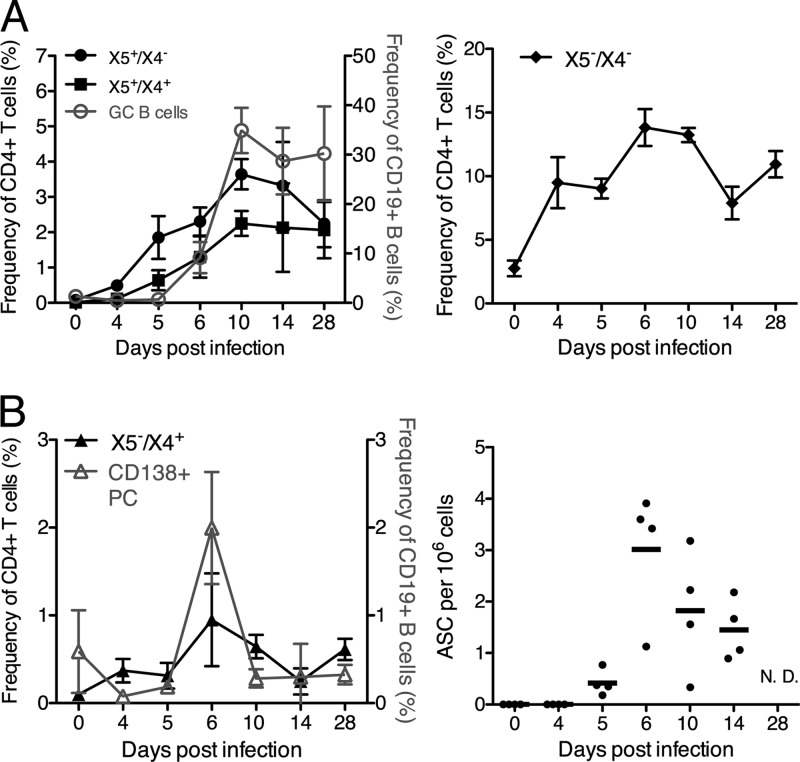
Fig 3.
Kinetics of ICOS+ CXCR5+ CXCR4+ T cells correlate with germinal center B cell responses during influenza virus infection. MedLN of influenza virus A/Mem71-infected BALB/c mice (n = 4 per time point) were analyzed by 8-color flow cytometry as described in the legend of Fig. 2A. (A and B) Shown are mean frequencies ± SD of X5+/X4−, X5+/X4+ (left), and X5−/X4− (right) CD4 T cells compared to germinal center B cell frequencies (GC B cells) (live, CD19+ CD38low CD24high) (A) and frequencies of X5−/X4+ cells and plasma cells (CD138+) (left) and antibody-secreting foci, as assessed by an enzyme-linked immunosorbent spot (ELISPOT) analysis (right) (B). ASC, antibody-secreting cells.

