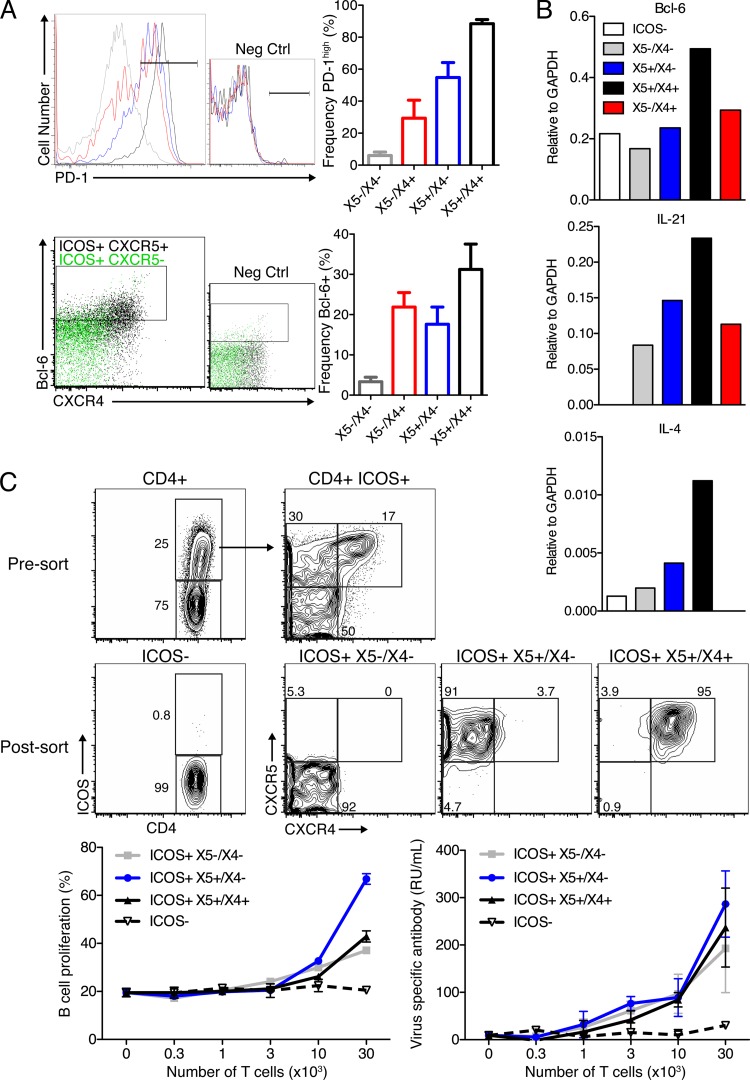
Fig 7.
Chemokine receptor expression is not associated with large differences in B helper function. (A, top) Representative overlay histogram plots of PD-1 expression among ICOS+ CD4+ T cells (gray line, X5−/X4−; red line, X5−/X4+; blue line, X5+/X4−; black line, X5+/X4+). (Bottom) Colored dot plots for the expression of Bcl-6 and CXCR4 among ICOS+ CXCR5+ (black) and ICOS+ CXCR5− (green) cells. CXCR4+ cells (i.e., largely ICOS+ X5+/X4+) are enriched for Bcl-6 expression in both frequency and intensity. Bar graphs indicate mean frequencies ± SD of expression of the indicated surface marker within the given ICOS+ population. Data were pooled from two experiments analyzing individual mice (n = 4 each). (B) Gene expression analysis of FACS-purified MedLN CD4 T cell subsets isolated from influenza virus A/Mem71-infected mice at day 10 (n = 4). Shown are transcript levels relative to GAPDH expression levels. Data are representative of two replicate experiments (one with BALB/c mice and one with C57BL/6 mice). (C, top) Shown are 5% contour plots of CD4 T cells pre- and post-FACS purification. T cells were cocultured with MACS-enriched CFSE-labeled B cells from lymph nodes of influenza virus-immunized mice, as outlined in the legend of Fig. 1. Cells were cultured in triplicate, and mean frequencies ± SD of proliferating CFSElo B cells (left) and relative antibody concentrations in supernatants (right), as assessed by ELISA, are displayed. RU, relative units. Results are from one of two experiments that yielded comparable results.

