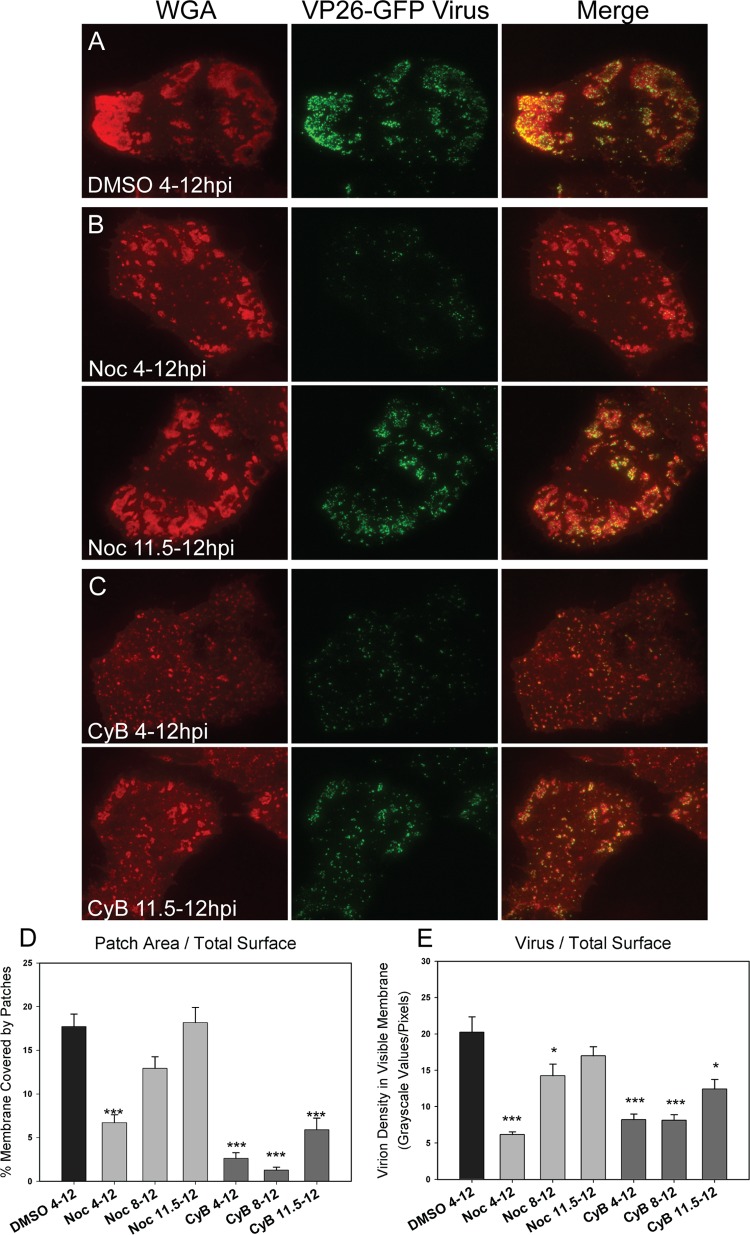
Fig 5.
Role of microtubules and actin in virus/glycoprotein trafficking and patch formation. Cells were infected with VP26-GFP HSV-1 and fixed at 12 hpi. (A) TIRF micrograph of DMSO-treated sample stained with rhodamine-WGA to mark glycoprotein patches. (B) TIRF micrographs of infected cells treated for the noted intervals during infection with 10 μg/ml nocodazole (Noc). Cells were stained with WGA. Note that patches in the 4- to 12-hpi treatment sample are smaller, with fewer virions than the control. (C) TIRF micrographs of infected cells treated for the noted periods with 1.7 μg/ml cytochalasin B (CyB). Patches were labeled with WGA. Note that treatment has disrupted glycoprotein patch structures. (D) Graph depicts the percentage of cell membrane that is covered in glycoprotein-rich patches. Numbers were obtained by dividing the sum of the patch areas (that were above the 300-pixel cutoff) by the total area of the cellular adherent membrane visible in TIRF micrographs. (E) Graph depicts the amount of virus on the cellular adherent membrane visible by TIRF microscopy. Twenty-five cells per sample set were analyzed. Error bars are for the standard errors of the means. P values of treated samples compared to DMSO control samples are labeled the following: *, <0.05; **, <0.005; and ***, <0.0005.

