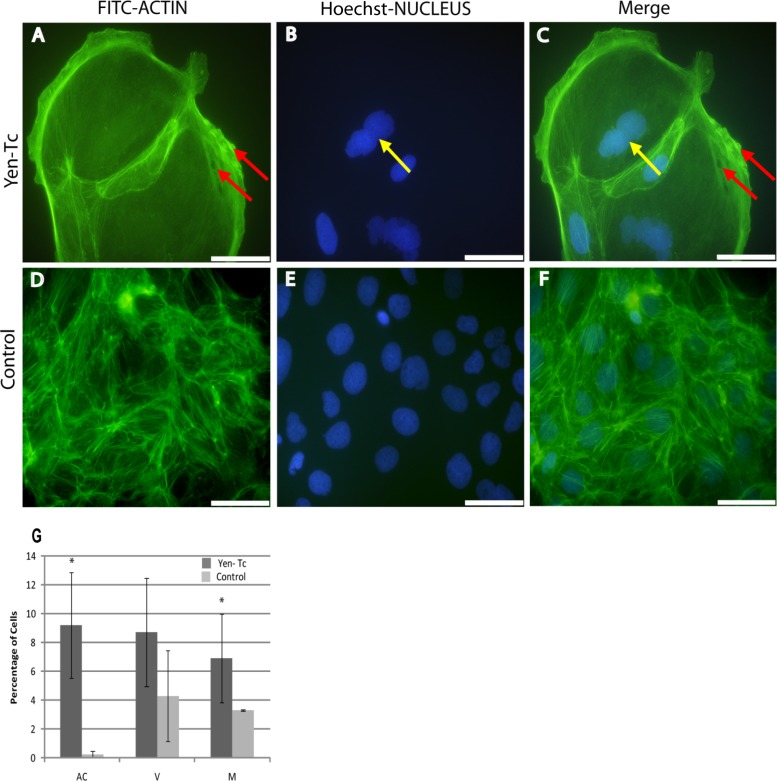
Fig 6.
(A to F) Fluorescence micrographs of Caco-2 cells topically treated with the native Y. entomophaga toxin complex (A to C) or the Tris buffer control (D to F). Cells were stained for F-actin with FITC-phalloidin (A and D) and for nuclei with Hoechst 33258 DAPI stain (B and E); merged images are also presented (C and F). Red arrows indicate vacuoles (A and C), and yellow arrows indicate multinucleated cells (B and C). (G) Graph presenting percentages of cells (minimum of 360 cells) with multinucleation (M), actin condensation (AC), or vacuole (V) phenotypes observed. Asterisks indicate high numbers of cells showing multinucleation and actin condensation compared to the control. Error bars represent standard errors. Scale bars represent 50 μm.

