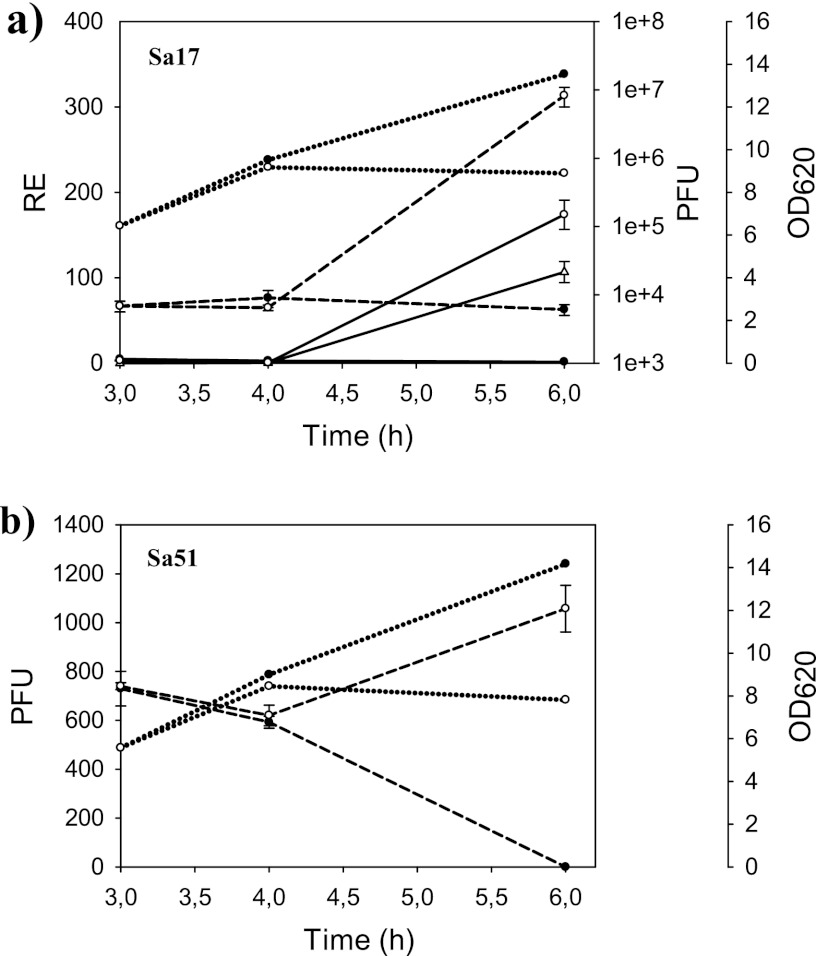
Fig 2.
Comparison of relative expression, PFU, and growth (OD620) of S. aureus Sa17 (a) and PFU and growth of Sa51 (b) in noninduced and induced cultures. The relative expression of short and long sea transcripts, together with PFU, was analyzed at 3 h, 4 h, and 6 h of cultivation. Filled symbols denote the results for noninduced (without MC) cultures, and open symbols denote the results for induced (with MC) cultures. Solid lines show the relative sea expression levels, with circles representing the short transcript and triangles the long transcript. Dashed lines show PFU, and dotted lines show growth. No relative sea expression and long transcript levels were detectable in Sa51.

