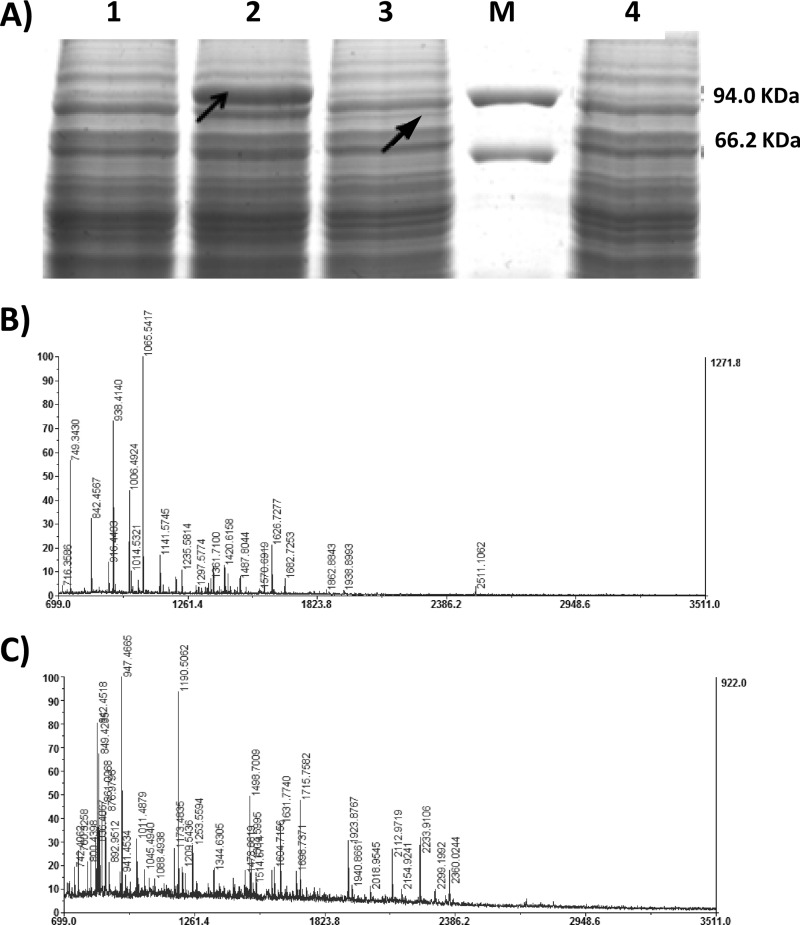
Fig 2.
Expression of gshF genes of L. monocytogenes, S. agalactiae, and L. plantarum in P. pastoris. (A) GshF expression analysis by SDS-PAGE. Recombinant P. pastoris cells were harvested after culture for 42 h in YPD. Cell lysate samples were subjected to 10% SDS-PAGE and then stained with Coomassie blue. Lane 1, GS115(control); lane 2, GS115/lmgshF; lane 3, GS115/LpgshF; lane 4, GS115/SagshF; lane M, protein molecular size markers. The arrows indicate the positions of GshF bands. (B) Peptide mass fingerprint of overexpressed bands in cell lysate of GS115/lmgshF (indicated by the left arrow in panel A). A MASCOT score of >82 (the default MASCOT threshold for such searches) was accepted as significant (P < 0.05). (C) Peptide mass fingerprint of overexpressed bands in cell lysate of GS115/LpgshF (indicated by the right arrow in panel A). A MASCOT score of >82 was accepted as significant (P < 0.05).

