Abstract
Toxoplasma gondii oocysts spread in the environment are an important source of toxoplasmosis for humans and animal species. Although the life expectancy of oocysts has been studied through the infectivity of inoculated soil samples, the survival dynamics of oocysts in the environment are poorly documented. The aim of this study was to quantify oocyst viability in soil over time under two rain conditions. Oocysts were placed in 54 sentinel chambers containing soil and 18 sealed water tubes, all settled in two containers filled with soil. Containers were watered to simulate rain levels of arid and wet climates and kept at stable temperature for 21.5 months. At nine sampling dates during this period, we sampled six chambers and two water tubes. Three methods were used to measure oocyst viability: microscopic counting, quantitative PCR (qPCR), and mouse inoculation. In parallel, oocysts were kept refrigerated during the same period to analyze their detectability over time. Microscopic counting, qPCR, and mouse inoculation all showed decreasing values over time and highly significant differences between the decreases under dry and damp conditions. The proportion of oocysts surviving after 100 days was estimated to be 7.4% (95% confidence interval [95% CI] = 5.1, 10.8) under dry conditions and 43.7% (5% CI = 35.6, 53.5) under damp conditions. The detectability of oocysts by qPCR over time decreased by 0.5 cycle threshold per 100 days. Finally, a strong correlation between qPCR results and the dose infecting 50% of mice was found; thus, qPCR results may be used as an estimate of the infectivity of soil samples.
INTRODUCTION
The protozoan parasite Toxoplasma gondii is a zoonotic pathogen that raises public health issues. Although toxoplasmosis is typically asymptomatic in immunocompetent people, recent outbreak studies have reported the occurrence of acute toxoplasmosis in healthy individuals (3, 6). The infection can cause severe damage in immunocompromised people, such as AIDS patients and fetuses (24). The parasite also causes abortions in production animals and economic losses.
Like other related protozoa, T. gondii has an environmental stage: oocysts are shed in cat feces, sporulate, and disperse in the environment, where intermediate hosts get infected. Oocysts are an important source of infection for both animals and humans. In a multicenter epidemiological survey, 6 to 17% of infections in pregnant women were attributed to oocysts (4). Using specific antioocyst antibodies, the proportions of infections attributed to oocysts were 43% in women from Chile (17), 78% in mothers of congenitally infected infants in North America (2), and 80% in swine from southern Chile (18).
Oocysts are known to be highly resistant in both soil and water (7, 12) and to most chemical and physical disinfectants (9, 12, 25, 26). However, we lack quantitative data on the dynamics of their survival in the environment (7). Most estimates were obtained using mouse inoculation: oocysts were considered to survive as long as soil samples were infectious for mice. However, because mice may get infected from a single oocyst, such assays indicate that at least one infective oocyst is present, and the level of sample contamination is not available at each time point.
The level of environmental contamination may also be estimated by counting or molecular methods (1). However, such methods do not estimate the infectivity of the detected oocysts. Establishing the relationship between sample infectivity and the level of oocysts detected by molecular methods would help to validate them for the study of environmental contamination.
Our first aim was to quantify T. gondii viability in soil under two conditions of soil water content, i.e., to estimate variations with time of the number of oocysts still detectable and the level of sample infectivity. Moreover, we aimed to study the relationship between the level of contamination detected by molecular methods and sample infectivity. Finally, sporulation and degradation may affect the density of oocysts and thus their recovery in a dense solution, which may affect the ability to detect environmental contamination, depending on the age of contamination. We aimed to search for a possible loss of detectability over time and estimate its importance.
MATERIALS AND METHODS
Oocyst production and recovery.
In October 2008, a 10-week-old specific-pathogen-free cat was infected with 3,000 cysts of the PRU strain (type II) at the Laboratoire de Parasitologie-Mycologie EA3800 in Reims, France. The oocysts shed by the infected cat were collected and concentrated as described elsewhere (16). Approximately 70 million oocysts were obtained, and they were induced to sporulate by adding 5 ml of 2% aqueous H2SO4 and by aerating the tube at room temperature for 7 days. Sporulated oocysts were then stored at +4°C for 3 months until their use in experiments.
Design of viability experiment.
Figure 1 illustrates the design of the experiment. Two plastic containers, each 36 cm long by 26 cm wide by 30 cm high, were filled with surface soil (collected from the top 5 cm) sieved using a 2-mm-sieve-size soil sieve. The same soil was used for other experiments (soil from Neyron, France, as described elsewhere [16]). Approximately 200 holes of 2 mm in diameter were made on the sides and bottom of each container, to let water run out. Each container represented a distinct rain condition (dry, damp). Rain was simulated using a pump installed in a tray with the container and two lines of watering drippers. A programmer was used to simulate 15 min of rain each week in the damp container and 15 min every 3 months in the dry one. These values correspond to rainfalls of 3,648 mm and 281 mm per year, respectively. The containers were kept at room temperature.
Fig 1.
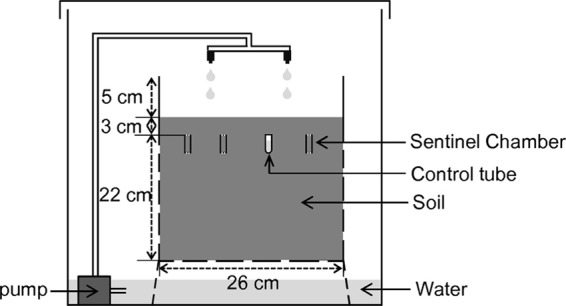
Experimental design for the viability experiment (only one container is represented). Test chambers were filled with 2.5 g of soil and inoculated with 1 ml of suspension containing 2 × 10⁵ oocysts. Control tubes contained 2 × 10⁵ oocysts diluted in 1 ml of Milli-Q water. The chambers exchanged with the soil in which they were buried, whereas the control tubes were hermetically sealed. The system was duplicated to compare two rainfall conditions: 15 min of rainfall was simulated each week for damp conditions or every 3 months for dry conditions.
Oocysts were placed in sentinel chambers, consisting of a cylinder placed vertically in the soil and closed by two filters (10). The upper side of the cylinder was closed with a 10-μm-pore-size filter, while the lower extremity had a 5-μm-pore-size filter. Each chamber contained 2.5 g of soil and was inoculated with 1 ml of water containing approximately 2 × 10⁵ oocysts. Controls were used to compare oocyst viability in water, taken as a reference environment, and in the chambers kept at the same temperature. Controls consisted of hermetically sealed 1.5-ml microcentrifuge tubes containing approximately 2 × 10⁵ oocysts suspended in 1 ml of Milli-Q water. In each container, 27 inoculated chambers and 9 control tubes were placed at random. Chambers and tubes were positioned vertically at a depth of 3 cm, located, and identified.
On each of the 9 sampling dates, three replicate chambers and one control tube chosen at random were extracted from each container. Eight samples were thus treated on each date. Inoculation of the chambers and tubes was performed on 13 February 2009, and samples were extracted at 1, 10, 33, 61, 109, 220, 299, 408, and 657 days after inoculation.
Analysis of relationship between age and detectability of oocysts.
To measure detectability, oocysts were kept under optimal conditions during the whole experiment except on the last sampling date, i.e., at +4°C in 2% sulfuric acid. On each date, soil samples of 5 g were inoculated with 105, 103, or 0 (control) oocysts. Each oocyst load was replicated four times. Detection by quantitative PCR (qPCR) was performed immediately after recovery of oocysts. Microscopic counting was also performed for the tubes obtained from samples inoculated with 105 oocysts, and the proportion of oocysts recovered by counting was calculated. We analyzed the temporal variations of the average proportions of oocysts and mean cycle threshold (CT) values obtained by qPCR using analyses of covariance (ANCOVAs) (23). We considered time, the initial load of oocysts (103 or 105), and their interaction as fixed effects. Scheffé's contrasts were used to compare the counting results at 1 day to those on the other dates.
Oocyst recovery from soil and microscopic counting.
On each date, oocysts were first concentrated and purified using a protocol for oocyst recovery elaborated during previous studies (previously described protocol C [16]). The following protocol was done either on 5 g of soil (in the detectability experiment) or on 2.5 g of soil (in the viability experiment), in which case all quantities were divided by 2. A first phase of dispersion was done by adding 10 ml of deionized water per 5-g sample and vortexing for 1 min. After the dispersion phase, 20 ml of cold sugar solution (specific gravity, 1.2) was placed under the sample solution (19) and the sample was centrifuged (1,500 × g, 20 min). The supernatant containing the interface between sugar and water was collected (approximately 13 ml), and 35 ml of deionized water was added. After the last centrifugation (1,500 × g, 20 min), a sediment of 1 ml was kept. The sediment was then divided into two equal parts; one was used for qPCR detection and microscopic counting, and one was used for mouse inoculation (only in the viability experiment). Counting was performed using a UV microscope (8). Fifteen microliters of the suspension was deposited on a Kova slide (Kova Glasstic slide 10; Hycor) to count 1 μl, i.e., 1 per 1,000 of the recovered oocyst suspensions. Each sample was counted twice, and the averages of the two counts were used for the analyses.
DNA extraction and real-time PCR procedures.
The centrifuged pellets designed for qPCR detection were submitted to three cycles of freezing-thawing for at least 4 h at +20°C and −80°C. DNA was extracted with a QIAamp DNA minikit (Qiagen) according to the manufacturer's instructions, including a treatment with proteinase K (1 h at 56°C). DNA extracts were subjected to a real-time quantitative PCR targeting the 529-bp repeated element (21) on an iQ5 instrument (Bio-Rad), according to the following method. The T. gondii AF 487550 gene was detected with TaqMan probe FAM-ACG CTT TCC TCG TGG TGA TGG CG-TAMRA (where FAM is 6-carboxyfluorescein and TAMRA is 6-carboxytetramethylrhodamine) and DNA oligonucleotide primers 5′-AGA GAC ACC GGA ATG CGA TCT-3′ and 5′-CCC TCT TCT CCA CTC TTC AAT TCT-3′. The DNA oligonucleotide primers and TaqMan probe were synthesized by Eurogentec S.A, Seraing, Belgium. The amplification mixture consisted of 12.5 μl of 2× reaction mix (Platinum quantitative PCR SuperMix UDG; Invitrogen), 2 mM MgCl2, 0.5 μM each oligonucleotide primer, 0.2 μM TaqMan probe, and 5 μl of template DNA in a final volume of 25 μl. To overcome PCR inhibition, 1 μl of 1% bovine serum albumin (BSA) was added to each sample mix before amplification. The reaction mixture was initially incubated for 3 min at 50°C to allow activation of the uracil-N-glycosylase (UNG). This incubation was followed by an incubation step for 3 min 30 s at 95°C to denature the template DNA, to inactivate the UNG enzyme, and to activate the Platinum Taq DNA polymerase. Samples were amplified as follows: 45 cycles of denaturation at 95°C for 15 s and annealing/extension at 60°C for 1 min. Each sample was deposited twice on a PCR plate. Results were expressed as the number of cycles needed to reach the detection threshold (CT).
Bioassay in mice.
After oocyst recovery, 500 μl of the original suspension was used for mouse inoculation. The suspension was completed to 1 ml, from which 900 μl was used directly for mouse inoculation (300 μl per mouse, corresponding to 15% of the suspension obtained after oocyst recovery) and 100 μl was used to prepare 10-fold serial dilutions.
Since the chambers were inoculated with approximately 2 × 10⁵ oocysts, we estimated that the inoculum given to each mouse contained oocysts that had survived and were recovered from an initial batch of 0.15 × 2 × 105 oocysts. Inoculations were also done using 300 μl of suspension after dilution by 10, 100, and 1,000. Mice were thus inoculated with oocysts surviving and recovered from initial batches of 30,000 (initial suspension), 3,000 (dilution, 10), 300 (dilution, 100), and 30 (dilution, 1,000) oocysts.
At each date and for each rain condition, we used samples from the three replicate sentinel chambers and one additional oocyst suspension from the control tube. Considering 2 containers, 3 + 1 replicates, and 4 dilutions of suspensions, we obtained 32 oocyst suspensions per date. Each of them was inoculated into 3 Swiss mice; thus, 96 mice were inoculated per date.
Four weeks after intraperitoneal inoculation of the suspension, mice were tested for seroconversion with the modified agglutination test (MAT) and sacrificed 8 weeks postinoculation (p.i.). Tissue cysts in brains of seropositive mice were detected by microscopic examination. Due to the high numbers of mice involved, inoculations were performed at the Laboratoire de Parasitologie-Mycologie, INSERM, UMR1094, in Limoges, France, for the collection dates of 10 and 61 days and at the Laboratoire de Parasitologie-Mycologie EA3800 in Reims for the other dates and for all other parts of the experiment.
Analysis of results on oocyst viability.
Because viability was supposed to follow an exponential model, counting results were log transformed using log(oocyst count + 1), while CT results were analyzed directly. The linearity of the relationship between the log-transformed counts and time or the CT values and time was tested for each condition of rain using a linearity test (23). We analyzed the variations of oocyst counts and CT values using ANCOVAs with time, rain condition, and their interaction as fixed effects (23). Mann-Whitney tests were used to compare log-transformed counts and CT values between dry and damp conditions at 1 day.
The proportion of infected mice was analyzed using a logistic model for the dose-response relationship, with dose being expressed as the log of the dilution of the original inoculation solution (0.001 to 1, with dilution 1 containing oocysts that survived and detected from an original pool of 30,000). The equation for the model was logit(proportion of infected mice) = β0 + (β1 × day) + (β2 × rain condition) + [β3 × log(dilution)] + (β4 × day × rain condition), where the β values represent the slopes of each effect (change per day or per dilution) or the contrast between the two rain levels, on the logit scale. This model was used to estimate the dose infecting 50% of mice (ID50), using the doBy package in R software (20). Finally, the relationship between mean qPCR values and ID50 was explored. Because qPCR was established from 50% of the suspension obtained from oocyst recovery, while inoculation at dilution 1 was done with 15% of the same solution, qPCR results were converted by adding log2(50/15), or 1.7355, to the observed values, to establish the relationship between qPCR CT values that would have been obtained from a 150-μl solution and the results obtained by inoculation of the same dose. All statistical procedures were done using R software (20).
RESULTS
Detectability experiment: counting and qPCR results.
The percentage of oocysts counted after recovery did not vary linearly with time (linear regression, P = 0.084, R2 = 0.07; Fig. 2A). However, comparison of the mean proportion recovered on each date to the proportion recovered at 1 day showed that significantly lower recovery rates were observed at 109 days (analysis of variance contrasts, P = 0.010) and 408 days (P < 0.001). On the contrary, the mean CT of qPCR slightly increased with time (linear regression, P = 0.027, R2 = 0.83) (Fig. 2B): the increase was estimated to be 0.436 (standard error, [SE], 0.190) CT per 100 days, with no significant difference between the two levels of oocyst concentrations (ANCOVA, P = 0.622).
Fig 2.
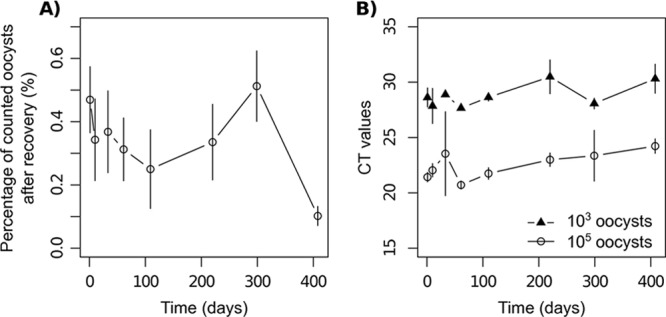
Detectability of oocysts aged 3 to 15.6 months, conserved at 4°C in H2SO4 (2%), after inoculation in soil. (A) Proportion of oocysts counted under a UV microscope after recovery from soil samples inoculated with 105 oocysts; (B) CT values obtained from qPCR performed after recovery of oocysts from soil samples inoculated with 105 and 103 oocysts as a function of time (days; 1 day corresponds to oocysts aged 3 months).
Viability experiment: counting and qPCR results. (i) Control oocysts in tubes.
No data were obtained for the control samples under dry conditions at 408 days and under damp conditions at 657 days, because the tubes opened in the containers before or during extraction. The number of oocysts recovered in the control tubes did not vary over time and between dry and damp conditions (ANCOVA, P = 0.778 and P = 0.519, respectively, for time and rain conditions). The average number of oocysts counted in the control was 2.63 × 10⁵ oocysts (5% confidence interval [CI] = 2.21 × 10⁵, 3.04 × 10⁵). Unexpectedly high CT values, ranging from 30.6 to 37.5, or nonamplified results were obtained with these samples. Quantitative PCR performed on dilutions of the DNA samples showed that the inhibitions may not have been caused by concentrations of DNA that were too high. Following Khosravinia et al. (14), we suggest that too many cells in the samples may have overloaded the system, preventing complete cell lysis and thus resulting in a low yield of DNA. Thus, CT values obtained from control tubes were not analyzed.
(ii) Oocysts in chambers.
Log-transformed counts were not significantly different between dry and damp conditions at time 1 day (Mann-Whitney test, P = 1); they then decreased linearly under both conditions (Fig. 3A). Under the dry condition, the decrease was clearly observed up to 220 days (linear regression, P < 0.001, R2 = 0.926) and no more than 0.5 oocyst, on average, was counted afterwards. The slope of the decrease was 1.946 log units per 100 days (SE = 0.138), i.e., 1 log unit every 51 days. Under the damp condition, the decrease was observed up to the end of the experiment, but with a lower slope of 0.694 log unit per 100 days (SE = 0.060, P < 0.001, R2 = 0.837), i.e., 1 log unit every 144 days. Both slopes were significantly different (ANCOVA, P < 0.001 for the period up to 220 days). Finally, using counting results, the proportion of oocysts surviving after 100 days was estimated to be 13.1% (5% CI = 5.2, 21.0) under dry conditions and 49.3% (5% CI = 38.6, 60.0) under damp conditions.
Fig 3.
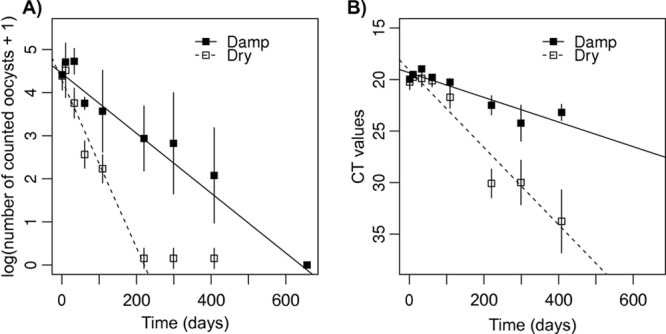
Viability experiment. (A) Log-transformed number of oocysts, counted under a UV microscope, after recovery from chambers; (B) CT values obtained from qPCR performed after recovery of oocysts from chambers, as a function of time (days), for dry and damp conditions.
Considering the qPCR results, the trends were identical to those found for the counting results (Fig. 3B), except that (i) detectable levels of contamination were observed up to 408 days, showing that qPCR was more sensitive than microscopic counting, and (ii) the decrease of CT values with time showed significant nonlinearity (linearity test, P = 0.044 and 0.029 for dry and damp conditions, respectively). No significant effect of water content was observed at 1 day (Mann-Whitney test, P = 1). Under dry conditions, the decrease was estimated to 3.750 CT per 100 days (SE = 0.272, P < 0.001, R2 = 0.896). Under damp conditions, the decrease was 1.196 CT per 100 days (SE = 0.150, P < 0.001, R2 = 0.743). Both slopes were significantly different (ANCOVA, P < 0.001). Using qPCR results, the proportion of oocysts detected after 100 days was 7.4% (5% CI = 5.1, 10.8) under dry conditions and 43.7% (5% CI = 35.6, 53.5) under damp conditions.
Overall, the decrease of contamination by oocysts was slightly more marked with qPCR results than with counting results, but the values observed with qPCR included both the loss of oocyst viability and the lower detectability of oocysts over time. To estimate the decrease only due to time, we corrected the observed slopes by considering a decrease of 0.504 CT per 100 days due to detectability. The changes in CT values with respect to time alone may then be estimated to be 3.750 to 0.504, or 3.246 CT per 100 days, under dry conditions and 1.196 to 0.504, or 0.692 CT per 100 days, under damp conditions. Using these qPCR results corrected for detectability, the proportion of oocysts still present after 100 days was estimated to be 10.5% under dry conditions and 61.9% under damp conditions.
Viability experiment: bioassay in mice. (i) Control oocysts in tubes.
The analysis of the control data showed a decrease in the infectivity of oocysts over time (logistic model, P < 0.001); however, no significant difference between conditions was observed (logistic model, P = 0.53). This model explained 64.38% of the deviance of the null model.
(ii) Oocysts in chambers.
As expected, the proportion of infected mice after inoculation of the suspension of recovered oocysts was generally higher under damp than under dry conditions for the 4 dilutions (Fig. 4). However, variable results were obtained. In particular, a low proportion of infection was recorded at day 299 in all batches of the damp condition.
Fig 4.
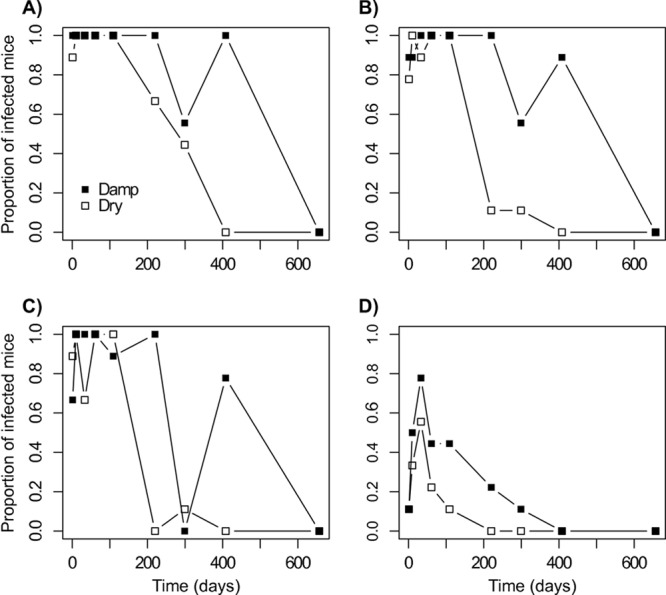
Viability experiment. Proportion of mice infected after inoculation of oocyst suspensions, obtained after recovery from chambers, at different concentrations as a function of time (days) for dry and damp conditions. (A) Original suspension; (B) dilution by 10; (C) dilution by 100; (D) dilution by 1,000.
The logistic model that best explained the proportion of infected mice included the effects of time, condition, and dose, with an interaction term between time and condition, showing that the proportion of infected mice decreased more rapidly under the dry condition: logit(proportion of infected mice) = (5.27 × 10⁻³ to 8.91 × 10⁻³ × day) − (0.39 × dry condition) + [1.54 × log(dilution) − 8.93 × 10⁻³] × day × dry condition (P < 0.001 for all parameter estimates except the dry condition parameter, where P = 0.27). The model explained 73.84% of the deviance of the null model. Parameters showed no difference between proportions of mice infected at 1 day under the dry and damp conditions (P = 0.977). For damp conditions, the odds ratio for time was 0.41 for 100 days; i.e., the probability of getting infected was divided by 1/0.41, or 2.44, in 100 days. Under dry conditions, the probability of getting infected was divided by 5.96 every 100 days.
We used the logistic model to estimate ID50s and their 95% confidence intervals for each date and condition. They ranged from −7.85 to 10.20 on the log scale (Fig. 5); i.e., the doses infecting 50% of mice ranged from 7.89 × 10⁻⁴ times the nondiluted dose inoculated (for damp conditions at 1 day) to 2.70 × 10⁴ times the nondiluted dose inoculated (for dry conditions at 657 days). Mice were inoculated with 15% of a suspension of oocysts recovered from an original pool of approximately 2 × 10⁵ oocysts, i.e., with a suspension recovered from an original pool of 3 × 10⁴ oocysts. Thus, oocysts recovered after 1 day in a damp soil from an initial amount of (3 × 104) × (7.89 × 10−4), or 23.67 oocysts, or recovered after 657 days in a dry soil from an initial amount of (3 × 104) × (2.70 × 104), or 8.10 × 10⁸ oocysts, would infect 50% of mice.
Fig 5.
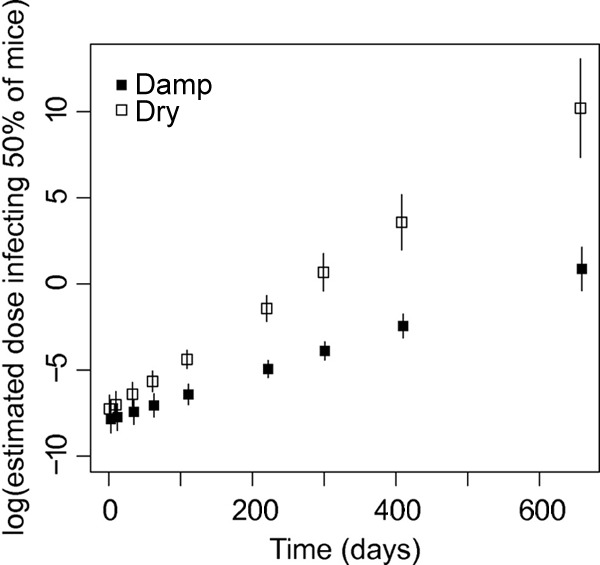
Viability experiment. Logarithm of the estimated ID50 with 95% confidence interval as a function of time (days) for dry and damp conditions. ID50s were obtained from the logistic model analyzing the probability that mice would be infected after inoculation of oocyst suspensions recovered from chambers.
When analyzing the relationship between qPCR CT values of the suspension and estimated ID50s, a remarkably linear relationship was found: the model log(ID50) = 0.7022 × (CT − 21.9203) showed an R2 value of 0.919 (Fig. 6). The dose obtained from this linear relationship is expressed as a fraction of the suspension tested using qPCR. For example, for a suspension showing a CT of 25, the predicted ID50 is 0.0127; i.e., 1.27% of the suspension used for qPCR is predicted to infect half of mice.
Fig 6.
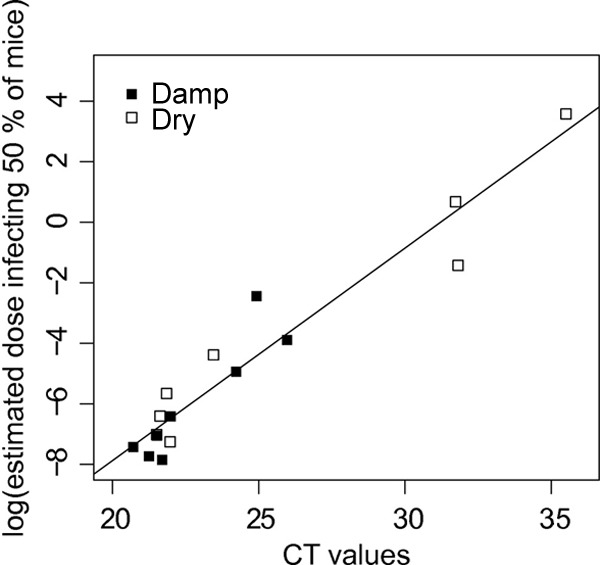
Relationship between CT values obtained from qPCR performed on oocyst suspensions recovered from chambers and the log of the dose infecting 50% of mice estimated from inoculation of the same suspensions into mice for dry and damp conditions.
DISCUSSION
Pathogens with an environmental stage raise important issues because of the difficulty with detection of them in environmental sources, such as water and soil, and decontamination of these sources. Our method providing data on pathogen dynamics over time and space may be used to predict environmental contamination and propose risk management guidelines.
Oocyst viability in soil was estimated over 21.5 months at two levels of rainfall. Using sentinel chambers, we were able to establish the viability curve of oocysts in a complex matrix where interactions with soil particles occur without any interference of dispersal. This method has also been used for other pathogens (5, 11, 13). A possible problem in using sentinel chambers is the local moisture conditions within chambers, which cannot be controlled. Although filters were fit at both extremities of the chambers, water may accumulate along the walls of the cylinders. However, we obtained the expected results with a higher viability under damp conditions, suggesting that the moisture content actually differed markedly between the two water content conditions. Furthermore, experiments conducted in this study compared only two extreme levels of water content and considered stable temperature and soil composition, while high temperatures may accelerate the inactivation of oocysts in natural environments (7, 11, 15). Finally, soil composition probably influences both oocyst detectability (16) and oocyst survival (11). Other experiments are thus required to further explore the variations in oocyst survival. However, these first estimates give points for comparison using rain conditions that are representative of extreme values observed in natural environments. Under dry conditions, the rain level (281 mm/year) lies in the range of values in semidesert climates, while under damp conditions, rainfall (3,648 mm/year) corresponded to levels observed in rainforests. We chose these extreme values to obtain a clear difference in survival of oocysts; however, intermediate levels of rainfall should be tested.
The detectability of oocysts kept at +4°C was stable over time by counting but decreased when qPCR was used. This decreased detectability by qPCR, which was not clearly related to the counting results, may be due to the deterioration of DNA in the remaining oocysts. A lower detectability is expected to interfere with qPCR estimates of oocyst viability and to reduce the amount of DNA found compared to the microscope counts. However, because only infective oocysts are relevant to estimate the level of risk for contaminated soils, qPCR results may be more accurate than counting to estimate the concentration of infectious oocysts.
Results of oocyst detection over time clearly showed oocyst inactivation. First, inactivation of oocysts may have occurred in water in the control samples. Results from these samples suggest that oocysts tended to lose their infectivity at the end of the experiment, although the number of oocysts in the tubes was stable over time under both conditions. These results may, however, be interpreted with caution because data were missing at day 408 and 657 and only 3 mice were inoculated per dilution and condition. Second, inactivation of oocysts was more important in soil under dry conditions than under damp conditions. As expected, microscope counting was the least sensitive procedure, with oocysts being undetected after 220 days under dry conditions. Quantitative PCR allowed us to detect oocysts up to 408 days after inoculation. Counting and qPCR results allowed us to estimate the decrease in oocyst concentration over time due to mortality and degradation. The estimated proportions of oocysts still detected after 100 days were 7.4% (by qPCR) to 13.1% (by counting) under dry conditions and 43.7% (qPCR) to 49.3% (counting) under damp conditions. We consider qPCR to be more appropriate than counting here, because it was more sensitive (it was able to detect oocysts at up to 408 days) and because the lower detectability at the end of the period suggests that noninfectious oocysts may be detected less often by qPCR than by counting; however, results from both methods are consistent. These estimates confirm the high resistance of oocysts in soil (7) and provide quantitative estimates for the proportion of oocysts surviving as a function of time. Quantitative PCR results showed nonlinearity, while the decrease of the counting values was linear, which suggests that DNA extraction and amplification brought variability to the detection method. Moreover, we observed PCR inhibition for samples with high oocyst concentrations, probably caused by inhibition of cell lysis because too many cells were in the samples. Similar inhibitions were observed for samples containing 105 oocysts suspended in 1 ml of deionized water, whereas samples containing 103 oocysts diluted before DNA extraction presented the expected CT values (data not shown). We suggest dilution of samples with high oocyst concentrations before DNA extraction for further experiments.
Mouse inoculation again proved to be a highly sensitive method: using 15% of the original oocyst suspension, all mice were infected by samples taken at up to 109 days under dry conditions and up to 220 days under damp conditions. This high sensitivity means that, using only a few mice, inoculation may be unable to differentiate between high and intermediate levels of contamination. Moreover, inoculation results were also variable (see Fig. 4 and the low proportion of mice infected at 299 days under damp conditions). However, by inoculating 9 mice (3 replicates × 3 mice) for each of 4 dilutions of the original solution, we were able to precisely estimate doses infecting 50% of mice (Fig. 5). Finally, the linear relationship between mean CT values obtained by qPCR and ID50s obtained by inoculation means that it is possible to accurately estimate the infectivity of oocysts using qPCR results. This result may be used to analyze environmental samples using qPCR.
This work may be used to estimate the level of contamination in environmental samples, in order to contribute to the understanding of parasite flows from points of contamination (cat feces) to remote areas where susceptible species may be present (22).
ACKNOWLEDGMENTS
We are grateful to P. Thulliez for his help in designing the study, S. Escotte for her help in the laboratory, and J. Bintz for his comments on the manuscript. We also thank F. Du and one anonymous reviewer for their comments and suggestions, which improved the quality and the clarity of the paper.
This work was financially supported by the project Dynamique Environnementale de Toxoplasma gondii of the Agence Française de Sécurité; Sanitaire de l'Environnement et du Travail (2007 to 2010). During the experiments, M. Lélu was financially supported by the Région Champagne Ardenne, the Conseil Général des Ardennes, and the Communauté de Communes de l'Argonne Ardennaise. M. Lélu is currently supported by a postdoctoral fellowship at the National Institute for Mathematical and Biological Synthesis, an institute sponsored by the National Science Foundation, the U.S. Department of Homeland Security, and the U.S. Department of Agriculture through NSF award EF-0832858, with additional support from the University of Tennessee, Knoxville.
Footnotes
Published ahead of print 11 May 2012
REFERENCES
- 1. Afonso E, et al. 2008. Spatial distribution of soil contamination by Toxoplasma gondii in relation with cat defecation behaviour in an urban area. Int. J. Parasitol. 38:1017–1023 [DOI] [PubMed] [Google Scholar]
- 2. Boyer K, et al. 2011. Unrecognized ingestion of Toxoplasma gondii oocysts leads to congenital toxoplasmosis and causes epidemics in North America. Clin. Infect. Dis. 53:1081–1089 [DOI] [PMC free article] [PubMed] [Google Scholar]
- 3. Carme B, et al. 2002. Severe acquired toxoplasmosis in immunocompetent adult patients in French Guiana. J. Clin. Microbiol. 40:4037–4044 [DOI] [PMC free article] [PubMed] [Google Scholar]
- 4. Cook AJC, et al. 2000. Sources of Toxoplasma infection in pregnant women: European multicentre case-control study. Br. Med. J. 321:142–147 [DOI] [PMC free article] [PubMed] [Google Scholar]
- 5. Davies CM, et al. 2005. Environmental inactivation of Cryptosporidium oocysts in catchment soils. J. Appl. Microbiol. 98:308–317 [DOI] [PubMed] [Google Scholar]
- 6. Demar M, et al. 2007. Fatal outbreak of human toxoplasmosis along the Maroni River: epidemiological, clinical, and parasitological aspects. Clin. Infect. Dis. 45:e88–e95 [DOI] [PubMed] [Google Scholar]
- 7. Dumètre A, Dardé ML. 2003. How to detect Toxoplasma gondii oocysts in environmental samples? FEMS Microbiol. Rev. 796:1–11 [DOI] [PubMed] [Google Scholar]
- 8. Dumètre A, Dardé ML. 2004. Purification of Toxoplasma gondii oocysts by cesium chloride gradient. J. Microbiol. Methods 56:427–430 [DOI] [PubMed] [Google Scholar]
- 9. Dumètre A, et al. 2008. Effects of ozone and ultraviolet radiation treatments on the infectivity of Toxoplasma gondii oocysts. Vet. Parasitol. 153:209–213 [DOI] [PubMed] [Google Scholar]
- 10. Jenkins M, Walker MJ, Bowman DD, Anthony LC, Ghiorse WC. 1999. Use of a sentinel system for field measurements of Cryptosporidium parvum oocyst inactivation in soil and animal waste. Appl. Environ. Microbiol. 65:1998–2005 [DOI] [PMC free article] [PubMed] [Google Scholar]
- 11. Jenkins M, Bowman D, Fogarty EA, Ghiorse WC. 2002. Cryptosporidium parvum oocyst inactivation in three soil types at various temperatures and water potentials. Soil Biol. Biochem. 34:1101–1109 [Google Scholar]
- 12. Jones JL, Dubey JP. 2010. Waterborne toxoplasmosis—recent developments. Exp. Parasitol. 124:10–25 [DOI] [PubMed] [Google Scholar]
- 13. Kato S, Jenkins M, Fogarty E, Bowman DD. 2004. Cryptosporidium parvum oocyst inactivation in field soil and its relation to soil characteristics: analyses using the geographic information systems. Sci. Total Environ. 321:47–58 [DOI] [PubMed] [Google Scholar]
- 14. Khosravinia H, Narasimha Murthy HN, Thertha Parasad D, Pirany N. 2007. Optimizing factors influencing DNA extraction from fresh whole avian blood. Afr. J. Biotechnol. 6:481–486 [Google Scholar]
- 15. Langkjær M, Roepstorff A. 2008. Survival of Isospora suis oocysts under controlled environmental conditions. Vet. Parasitol. 152:186–193 [DOI] [PubMed] [Google Scholar]
- 16. Lélu M, et al. 2011. Development of a sensitive method for Toxoplasma gondii oocyst extraction in soil samples. Vet. Parasitol. 183:59–67 [DOI] [PubMed] [Google Scholar]
- 17. Muñoz-Zanzi CA, Fry P, Lesina B, Hill D. 2010. Toxoplasma gondii oocyst-specific antibodies and source of infection. Emerg. Infect. Dis. 16:1591–1593 [DOI] [PMC free article] [PubMed] [Google Scholar]
- 18. Muñoz-Zanzi CA, Tamayo R, Balboa J, Hill D. 11 March 2012. Detection of oocyst-associated toxoplasmosis in swine from southern Chile. Zoonoses Public Health doi: 10.1111/j.1863-2378.2012.01471.x [DOI] [PubMed] [Google Scholar]
- 19. Ramirez NE, Sreevatsan S. 2006. Development of a sensitive detection system for Cryptosporidium in environmental samples. Vet. Parasitol. 136:201–213 [DOI] [PubMed] [Google Scholar]
- 20. R Development Core Team. 2010. R: a language and environment for statistical computing. R Foundation for Statistical Computing, Vienna, Austria: http://www.R-project.org [Google Scholar]
- 21. Reischl U, Bretagne S, Kruger D, Ernault P, Costa JM. 2003. Comparison of two DNA targets for the diagnosis of toxoplasmosis by real-time PCR using fluorescence resonance energy transfer hybridization probes. BMC Infect. Dis. 3:7. [DOI] [PMC free article] [PubMed] [Google Scholar]
- 22. Shapiro K, et al. 2010. Effect of estuarine wetland degradation on transport of Toxoplasma gondii surrogates from land to sea. Appl. Environ. Microbiol. 76:6821–6828 [DOI] [PMC free article] [PubMed] [Google Scholar]
- 23. Sokal RR, Rohlf FJ. (ed). 1995. Biometry: the principles and practice of statistics in biological research. WH Freeman & Co., New York, NY [Google Scholar]
- 24. Tenter AM, Heckeroth AR, Weiss LM. 2000. Toxoplasma gondii: from animals to humans. Int. J. Parasitol. 31:217–220 [DOI] [PMC free article] [PubMed] [Google Scholar]
- 25. Wainwright KE, et al. 2007. Physical inactivation of Toxoplasma gondii oocysts in water. Appl. Environ. Microbiol. 73:5663–5666 [DOI] [PMC free article] [PubMed] [Google Scholar]
- 26. Wainwright KE, et al. 2007. Chemical inactivation of Toxoplasma gondii oocysts in water. J. Parasitol. 93:925–931 [DOI] [PubMed] [Google Scholar]


