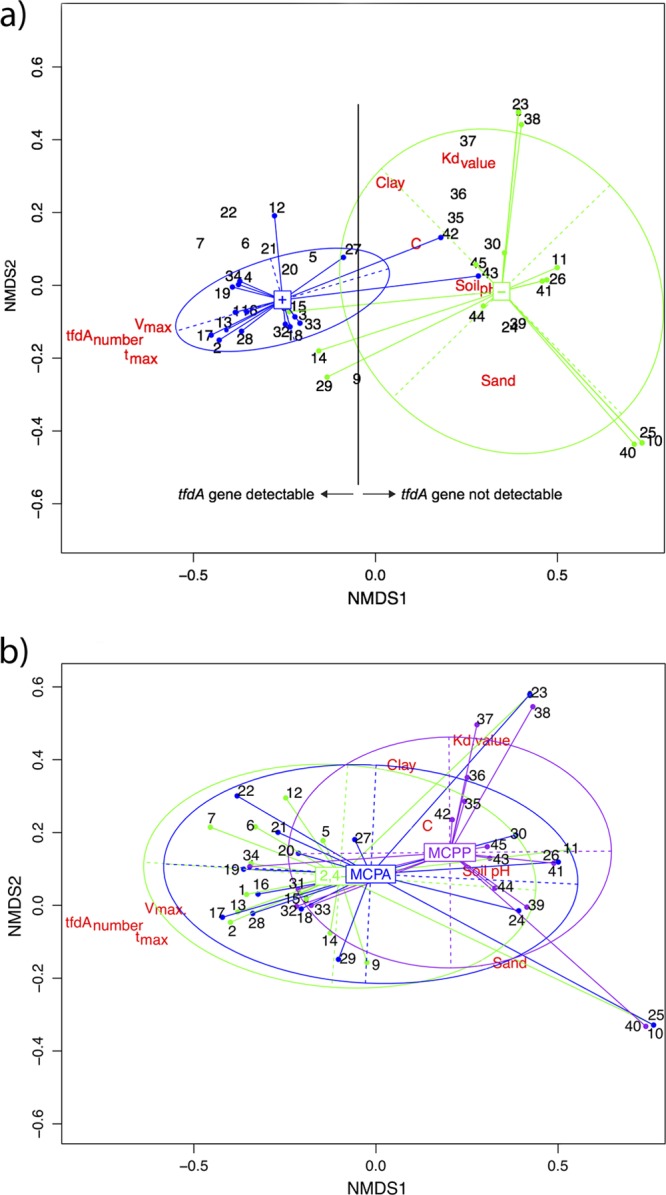
Fig 3.

Bidimensional NMDS plots. Panel a focuses on the effect of the presence (blue)/absence (green) of tfdA genes. Panel b focuses on the effect of the different PA 2,4-D (green), MCPA (blue), and MCPP (purple). If a sample is known to belong to a class, it is linked to the inertia center of its class. The horizontal and vertical widths of the class ellipses are equal to the variance of the NMDS coordinates, and the slope is equal to their covariance.
