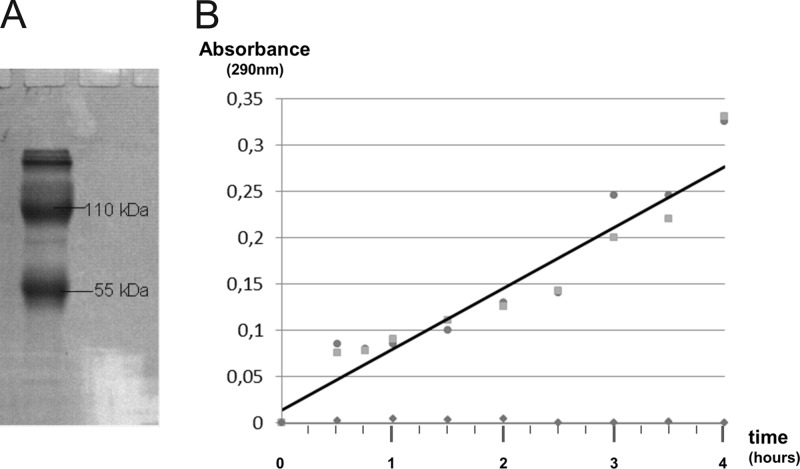
Fig 2.
Protein composition of the ZLPs and their enzymatic activity. (A) SDS-PAGE of purified ZLP preparation; molecular masses of the major proteins are indicated. (B) Tetrathionate hydrolase activity of the ZLPs; the absorbance at 290 nm of the assay mixture, from duplicate experiments (indicated with squares and circles), is plotted over time. The average values are shown by a black line. The results of the control experiment in the absence of tetrathionate are shown with diamond symbols.

