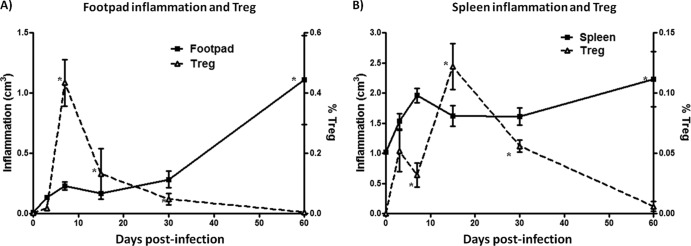
Fig 4.
CD4+ Foxp3+ Treg cells reduce inflammation of the mouse footpad and spleen. (A) A solid line represents the foot inflammation calculated though ellipse formula, and a dashed line represents the percentage of CD4+ Foxp3+ (Treg) cells. (B) A solid line represents the spleen inflammation calculated though ellipse formula, and a dashed line represents the percentage of CD4+ Foxp3+ (Treg) cells. The data represent the means of five mice per group ± the SEM. Statistical analyses were performed using one-way ANOVA, and the post hoc test was Tukey's (*, P < 0.05). The data are representative of three experiments of similar experimental design.

