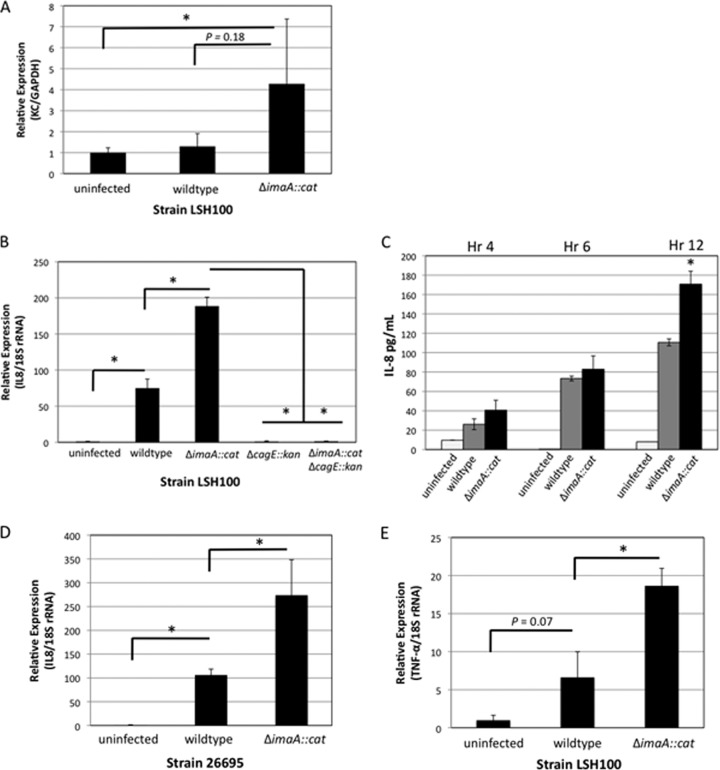
Fig 5.
KC and Il8 levels are significantly elevated in Δima::cat mouse and AGS cell infections, respectively. (A) Male FVB/N mice were infected with either the wild-type LSH100 strain or its isogenic mutant, the ΔimaA::cat mutant, for 3 weeks. Quantitative RT-PCR (qRT-PCR) was performed on whole gastric tissue to analyze the expression of KC using primers by the method of Yamaoka et al. (84). Mouse samples are the same as in Fig. 2A and include 5 mice infected with the wild-type LSH100 strain, 8 mice infected with the ΔimaA::cat mutant, and 6 uninfected mice. There was a significant difference (P < 0.05 by Student's t test) in KC between uninfected mice and mice infected with the ΔimaA::cat mutant as indicated by the L-shaped bracket and asterisk. (B) Il8 transcript levels are elevated in AGS cells infected with the ΔimaA::cat mutant. For transcript analysis, AGS cells were infected with either wild-type LSH100 or its isogenic single mutants, the ΔimaA::cat or cagE::kan mutant, or the ΔimaA::cat cagE::kan double mutant at an MOI of 100. qRT-PCR was performed to analyze the expression of interleukin-8 (Il8) using primers by the method of Nazarenko et al. (55) after 2 h of infection. These data represent 5 independent infections (biological replicates) with reactions done in triplicate. All differences in expression were calculated by the ΔΔCT method (47) and statistically significant differences (P < 0.01 by Student's t test) for AGS cell infections are indicated by an L-shaped bracket and asterisk. (C) ELISAs for IL-8 levels were conducted on culture media taken from AGS cells infected with either wild-type H. pylori or with the ΔimaA::cat mutant (MOI of 1) at the following time points: 4, 6, and 12 h postinfection. Data show two biological replicates, each done with two technical replicates. Values that were statistically significantly different (P < 0.03 by Wilcoxon rank sum test) are indicated by an asterisk. (D) Il8 expression levels in AGS cells infected with either wild-type strain 26695 or its isogenic mutant, the ΔimaA::cat mutant strain. Data represent 5 independent infections with reactions done in triplicate. The differences in expression were analyzed by the ΔΔCT method (47). Values that were statistically significantly different (P = 0.01 by Student's t test) are indicated by an L-shaped bracket and asterisk. (E) Analysis of TNF-α transcript levels in AGS cells infected with wild-type LSH100 or its isogenic mutant, the ΔimaA::cat mutant strain. Data represent 5 independent infections with reactions done in triplicate. The differences in expression were analyzed by the ΔΔCT method (47). Values that were statistically significantly different (P < 0.05 by Student's t test) are indicated by an L-shaped bracket and asterisk.

