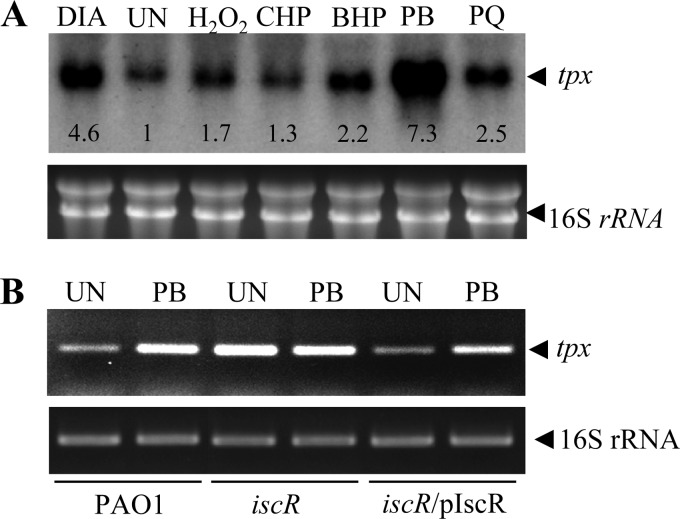
Fig 2.
Expression analysis of tpx. (A) Autoradiogram of a Northern blot analysis of tpx expression in an RNA sample extracted from exponential-phase PAO1 cells left untreated (UN) or treated with 0.25 mM H2O2, 0.5 mM cumene hydroperoxide (CHP), 0.5 mM t-butyl hydroperoxide (BHP), 0.5 mM plumbagin (PB), 0.25 mM paraquat (PQ), and 0.5 mM diamide (DIA) for 15 min. The number below each hybridized band represents the fold change in band intensity relative to the untreated culture. The RNA gel is shown below the autoradiogram to illustrate equal quantities of the RNA loaded. (B) The expression level of tpx in PAO1 strains was determined using endpoint RT-PCR. The exponential-phase cells of the PAO1 wild type, iscR mutant, and a complemented strain (iscR/pIscR) were treated with 0.25 mM PB for 15 min prior to RNA extraction. PCR was performed as described in Materials and Methods.

