Fig 1.

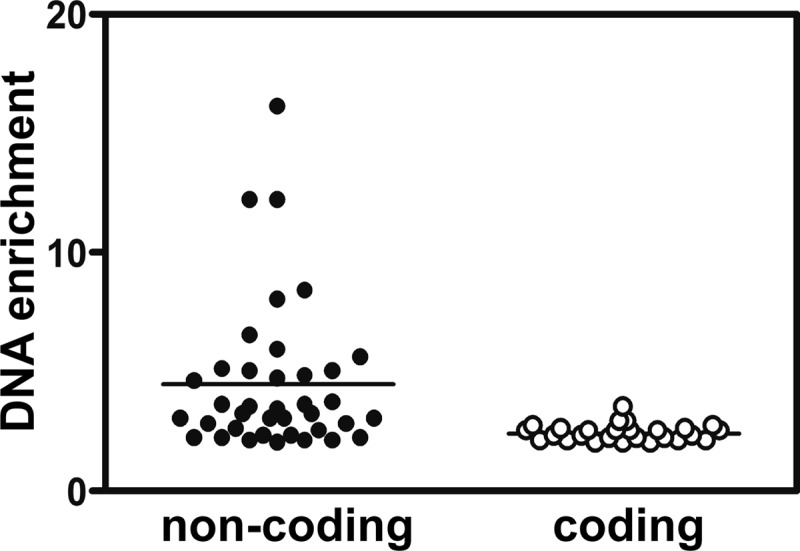
Noncoding DNA was enriched more than coding DNA. The level of DNA enrichment for each Rgg binding site was plotted, and the means were compared by using the Student t test. The difference was significant (P < 0.0001).

Noncoding DNA was enriched more than coding DNA. The level of DNA enrichment for each Rgg binding site was plotted, and the means were compared by using the Student t test. The difference was significant (P < 0.0001).