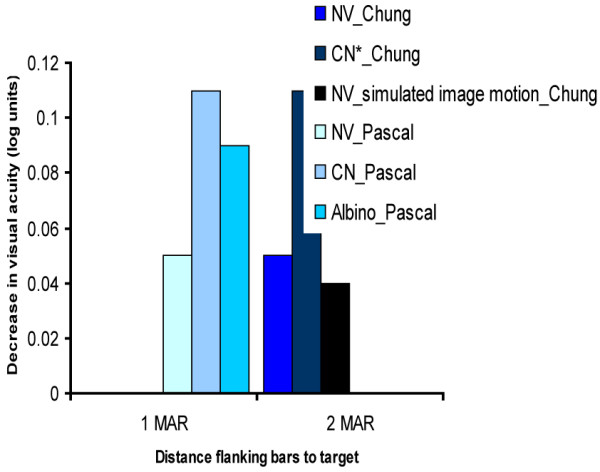
Figure 3.

The magnitude of contour interaction effects at 1 and 2 MAR. Figure 3 presents the results of two studies which have measured the magnitude of the contour interaction effect in adults with normal vision, adults with congenital nystagmus (CN) and adults with albinism. As can be seen, the magnitude of the effect (defined by the decrease of visual acuity in log units) is the largest in adults with CN in both studies. Standard errors of the mean were not provided.
