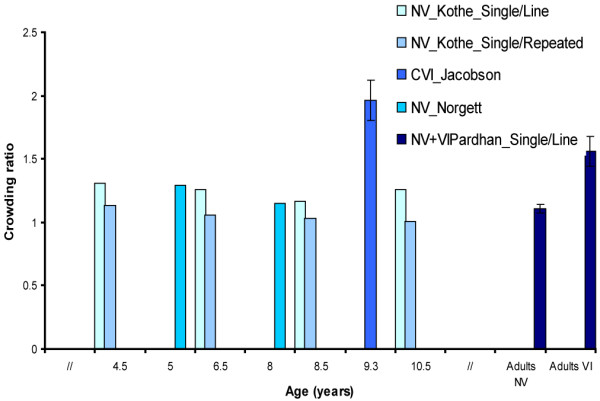
Figure 4.

Crowding ratios measured with charts with 100% interoptotype spacing. Figure 4 presents the results of four studies which measured crowding ratios in different populations: children and adults with normal vision (NV), children with cerebral visual impairment (CVI), and visually impaired (VI) adults. Children with CVI and adults with VI showed higher crowding ratios than respectively children with NV and adults with NV. Error bars ± 1 s.e.m.
