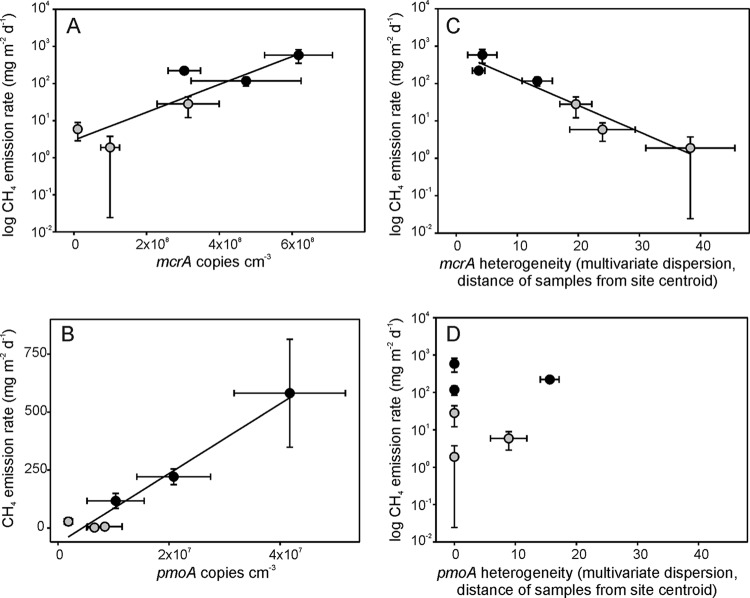
Fig 1.
Abundance (A and B) and within-site community heterogeneity (C and D) of methanogens (mcrA) and methanotrophs (pmoA) in six peatlands in relation to CH4 emission rate at the time of sampling. Black symbols represent natural sites, and gray symbols represent restored sites. Each data point represents the average of 7 or 8 field replicates ± standard error (SE). Microbial abundance was measured by quantitative PCR (gene copies cm−3 peat). Community heterogeneity was determined as multivariate dispersion based on T-RFLP or DGGE fingerprints. Note the logarithmic scale on the y axis in panels A, C, and D. The regression line is shown for data sets with significant relationships.

