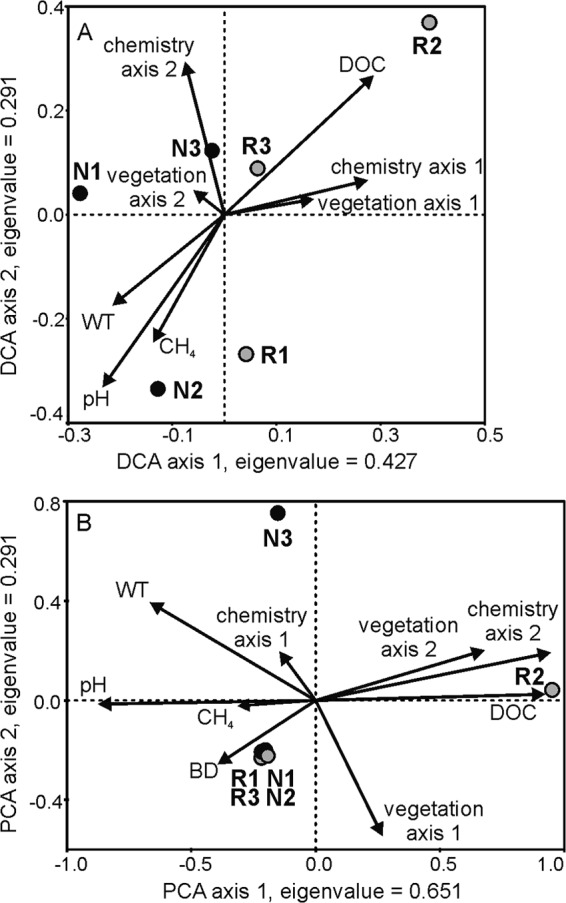
Fig 2.

(A) Detrended correspondence analysis (DCA) of methanogen communities and (B) principal component analysis (PCA) of methanotroph communities in natural (N1 to N3) and restored (R1 to R3) peatlands (n = 7 to 8; only the site centroid is shown). The first two axes accounted for 42% (methanogens) and 87% (methanotrophs) of community variation. Communities were analyzed by mcrA T-RFLP and pmoA DGGE of peat samples. Arrows represent environmental variables. WT, water table level; DOC, dissolved organic carbon; CH4, mean emission rate for the growing season. Vegetation axis 1 refers to DCA axis 1 (wet-dry gradient) and vegetation axis 2 to DCA axis 2 (variation between restored sites related to plant species benefitting from disturbance) in Fig. S1 in the supplemental material. Chemistry axes 1 and 2 refer to PCA axes in Fig. S1C for methanogens and Fig. S1B for methanotrophs.
