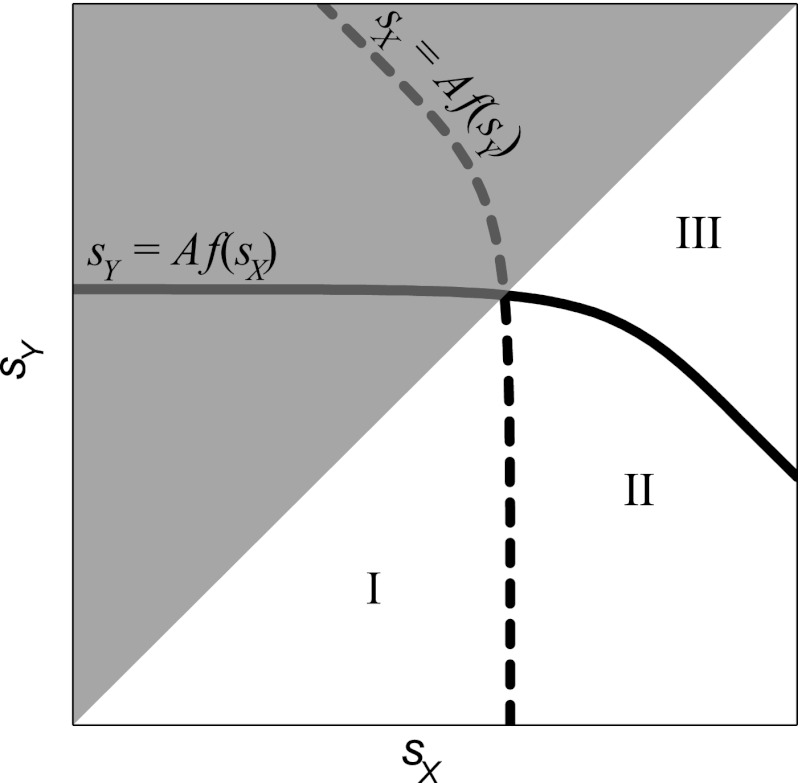
Fig 3.
Schematic illustration of regions where MDR is expected to evolve under different treatments. Any pair of antibiotics X and Y with costs of resistance sX and sY (such that sX > sY) represents a point in the lower semiplane of the sX,sY plane. The region to the left of the dashed line is the region where MDR is expected to evolve under the strong-weak treatment (i.e., when antibiotic X is applied first). The region below the solid line is the region where MDR is expected to evolve under the weak-strong treatment (i.e., when antibiotic Y is applied first). The parameter region where MDR evolves under the strong-weak treatment (region I) is strictly smaller than the region where MDR evolves under weak-strong treatment (regions I and II). Thus, the strong-weak treatment represents a safer bet against MDR evolution under uncertainty.

