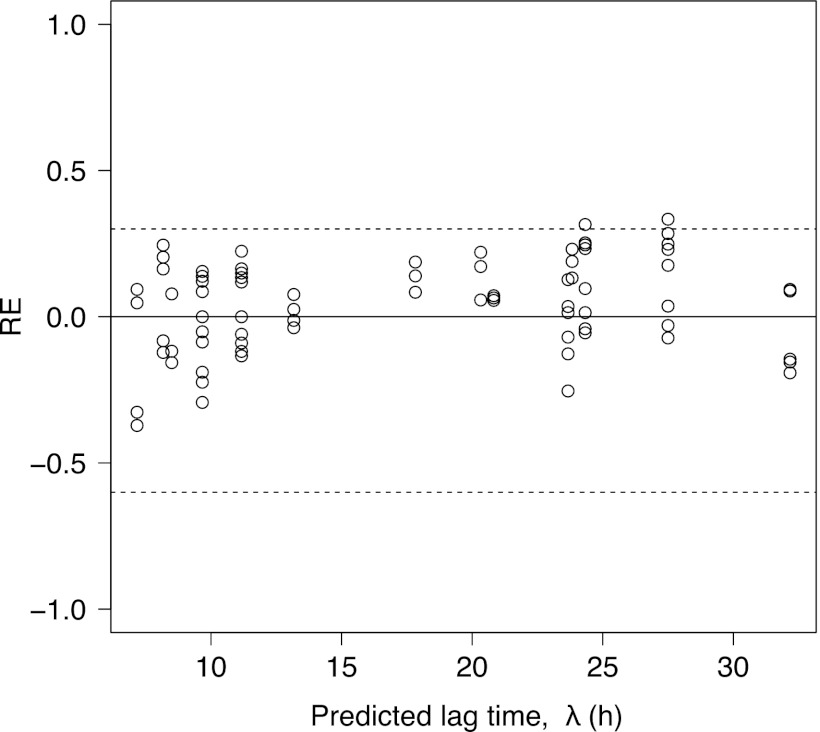
Fig 5.
Relative error (RE) plots comparing the observed and predicted values (at P = 0.5) of the lag time of B. cereus fitted by equation 9. The dotted lines represent the acceptable prediction zone for an RE of −0.6 (fail-safe) to 0.3 (fail-dangerous).

