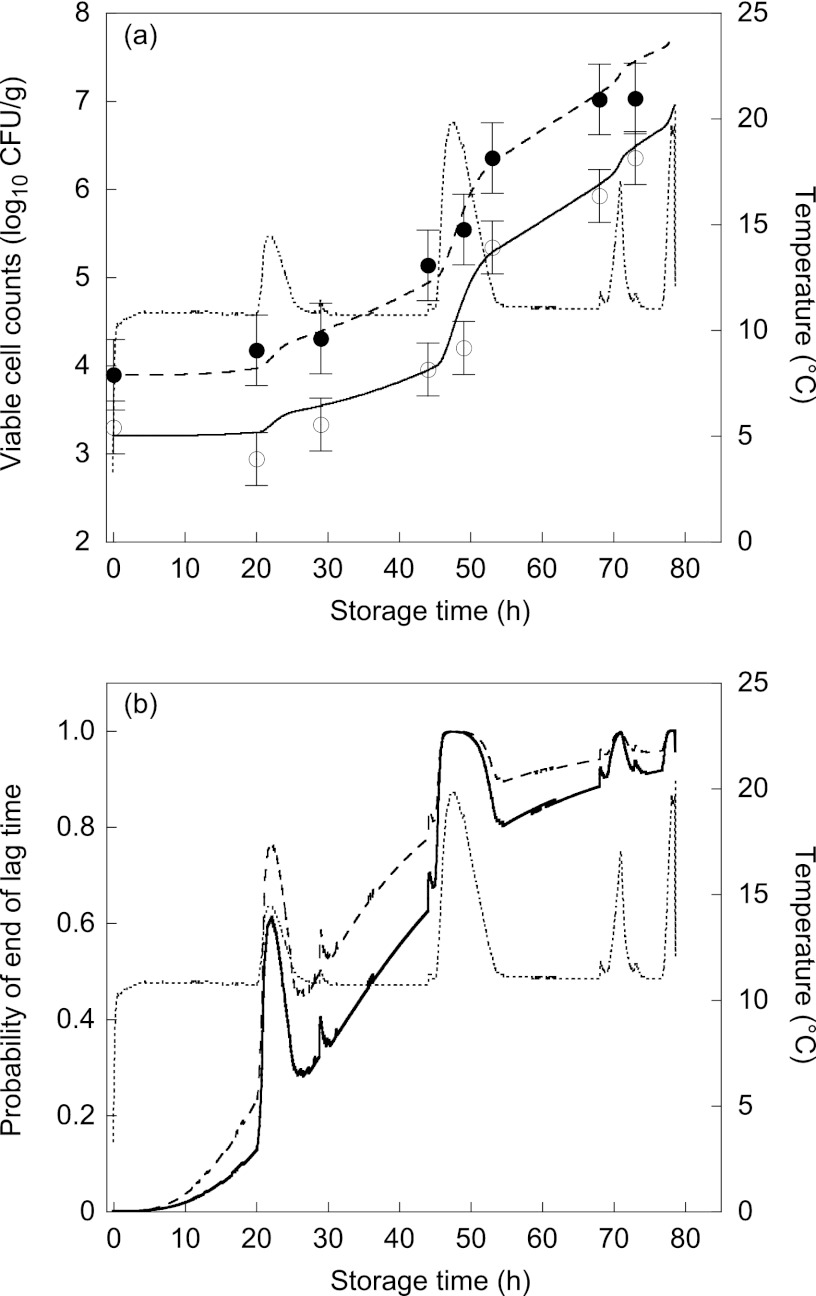
Fig 9.
(a) Experimentally observed changes in the number of B. cereus cells in cream pasta sauces and the growth prediction under fluctuating temperatures calculated using equation 13. The dotted line represents changes in temperature. Filled and open circles represent the observed B. cereus number (log CFU/g) in sauces I (pH 6.20, 1.05% NaCl) and II (pH 5.95, 1.59% NaCl), respectively. The dashed and solid lines represent model predictions for sauces I and II, respectively. The root mean squared errors for sauces I and II were 0.17 and 0.18, respectively. (b) Probability of the end of lag time corresponding to temperature changes. The dotted line represents changes in temperature. The dashed and solid lines represent model predictions for sauces I and II, respectively.

