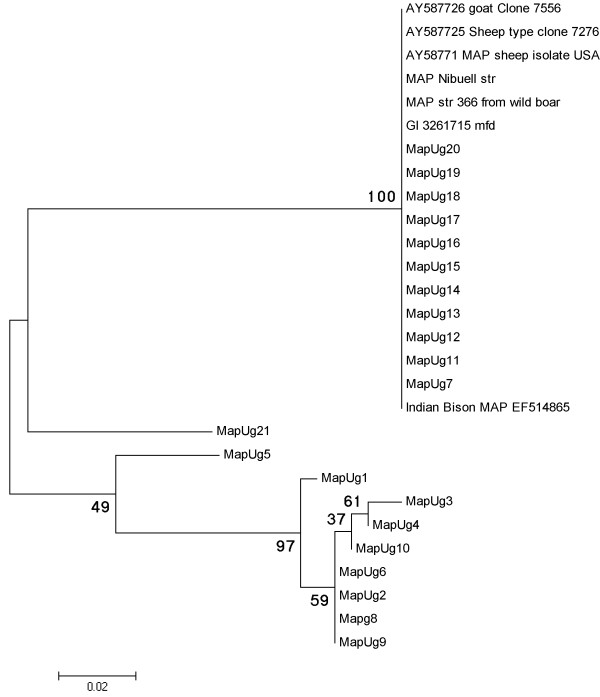
Figure 3.
Phylogenetic tree of homologous partial SSR locus 8 sequences (289 bp) inferred with maximum likelihood analysis based on the Tamura-Nei model. The numbers on each branch are the non-parametric bootstrap (NPB) probabilities. Sequences represent the 21 isolates (MapUg1 – MapUg21) compared with GenBank records including the reference strain MAP strain K10 and others. All GenBank records including the sheep, cattle and bison type clustered together with 11 isolates whereas the remaining isolates were distinguished into 7 different types.

