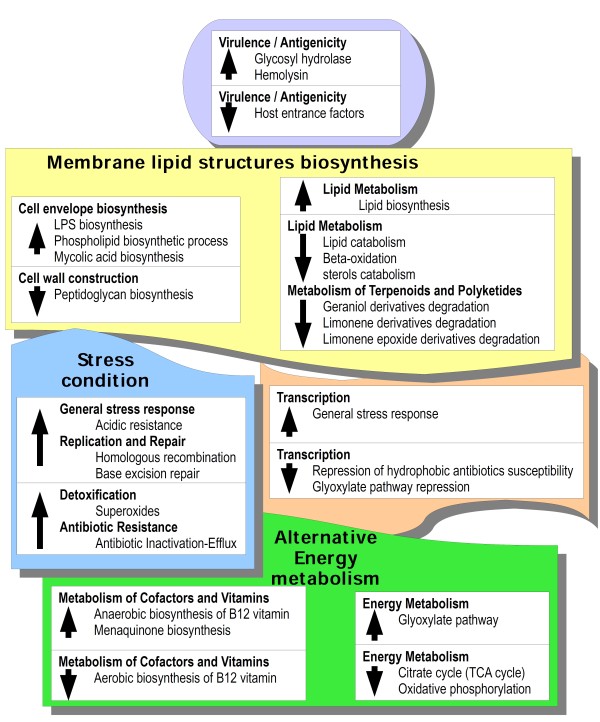
Figure 2.
Schematic diagram of MAP transcriptional response during THP-1 infection. Differentially expressed genes during cellular infection were grouped based on the Kyoto Encyclopedia of Genes and Genomes (KEGG) classification and sorted by function. Up arrows indicate an up-regulation of genes to the related metabolism whereas down arrows indicate a down-regulation.

