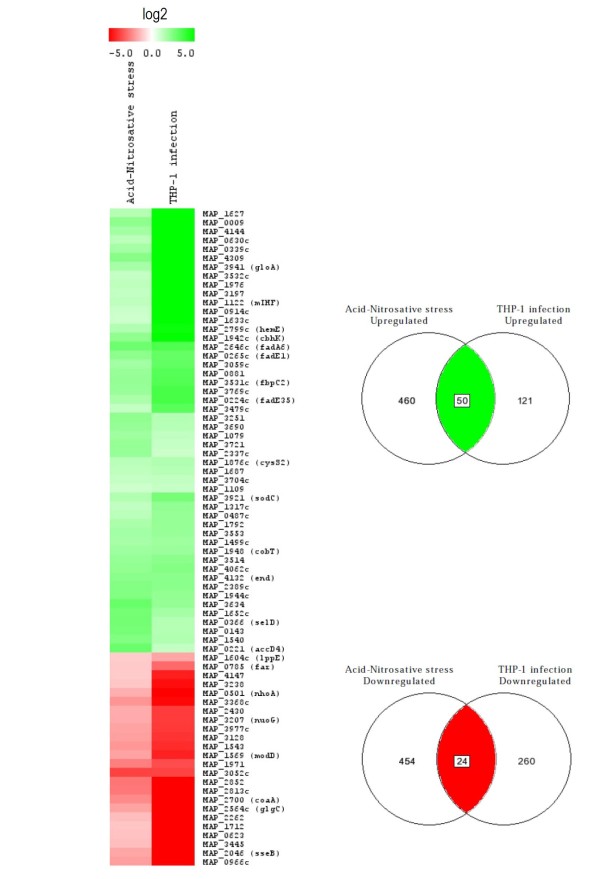
Figure 3.
Functional clustering of common regulated MAP genes under acid-nitrosative multi-stress and THP-1 infection. Expression ratios were log2-transformed, and displayed according to the color code at the top of the figure. Venn diagrams showing the number of overlapping and unique genes modulated more than 2.0-fold under the two experimental conditions are on the right of each colored macrocluster. The number of induced or repressed overlapping genes is indicated in the green ellipse or red ellipse, respectively.

