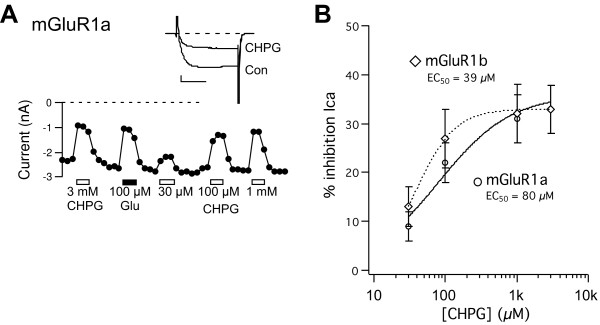
Figure 3.
CHPG induces strong calcium current modulation in SCG neurons expressing mGluR1a and 1b.A, Time course and sample current traces (inset) illustrating the magnitude of calcium currents in a representative mGluR1a expressing SCG neuron and inhibition by various concentrations of CHPG and by 100 μM Glu, as indicated. Cells were held at −80 mV and current was elicited by a 25 msec step to +10 mV. Scale bars represent 0.5 nA and 10 msec. B, Dose response curves for CHPG in cells expressing mGluR1a (open circles) or mGluR1b (open diamonds, as indicated. For mGluR1a, n = 12 at all concentrations. For mGluR1b (30–3000 μM), n = 5, 6, 7 and 7, respectively.

