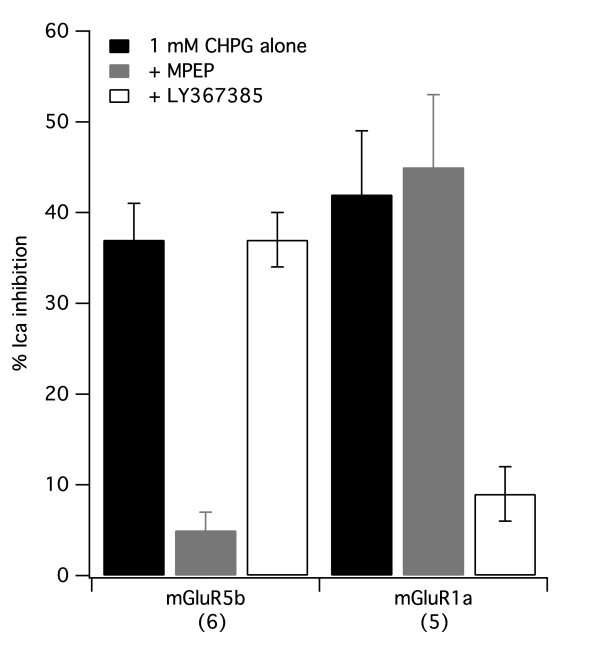
Figure 5.
Effect of selective inhibitors on CHPG effects in mGluR5b and 1a expressing cells. Average (± SEM) calcium current inhibition produced by application of 1 mM CHPG alone (black) or in the presence of 1 μM MPEP (gray) or 50 μM LY367385 (white) in SCG neurons expressing the indicated receptor. Number of cells in each group shown in parentheses.

