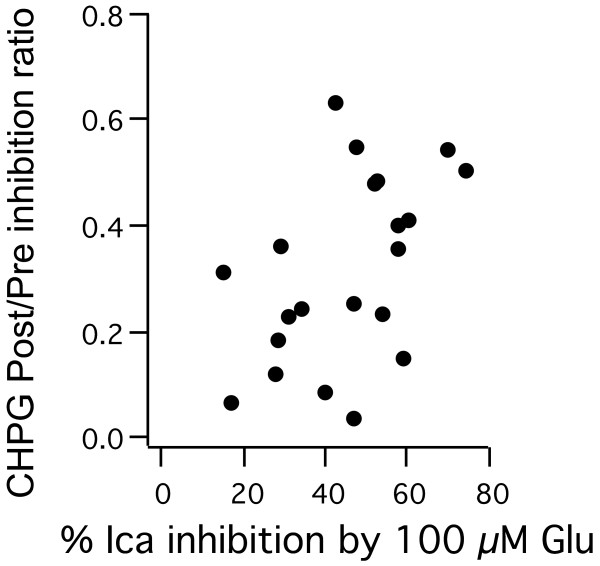
Figure 8.
Relative strength of Gqactivation by CHPG is not well correlated with apparent mGluR1 expression level. Relative strength of the Gq inhibitory pathway, expressed as the Post/Pre inhibition ratio vs. apparent mGluR1 expression level, expressed as magnitude of inhibition by 100 μM Glu in each cell. Note that all of the mGluR1 expressing cells recorded are shown, not just those with strong Gq components, as in Figure 7.

