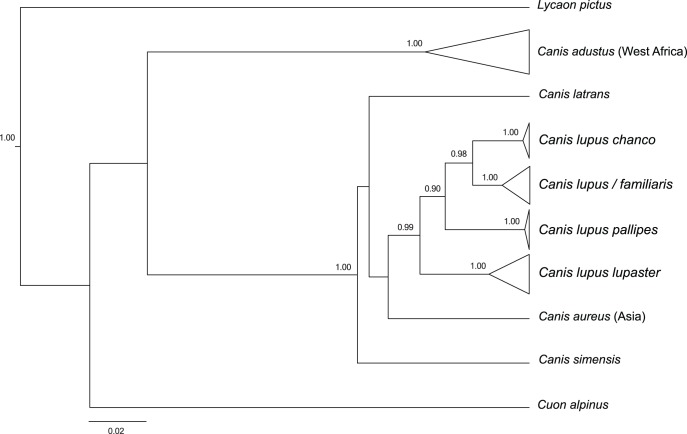
Figure 2. Bayesian phylogenetic analysis of the wolf-like clade based on cytochrome b and control region.
The model HKY + I + Γ was applied to the coherent fragment “cytochrome b + control region”, assuming a constant size coalescent model. Values at nodes correspond to posterior probabilities ≥0.90. Clades were collapsed for better readability of the tree. Scale bar represents 2% sequence divergence.

