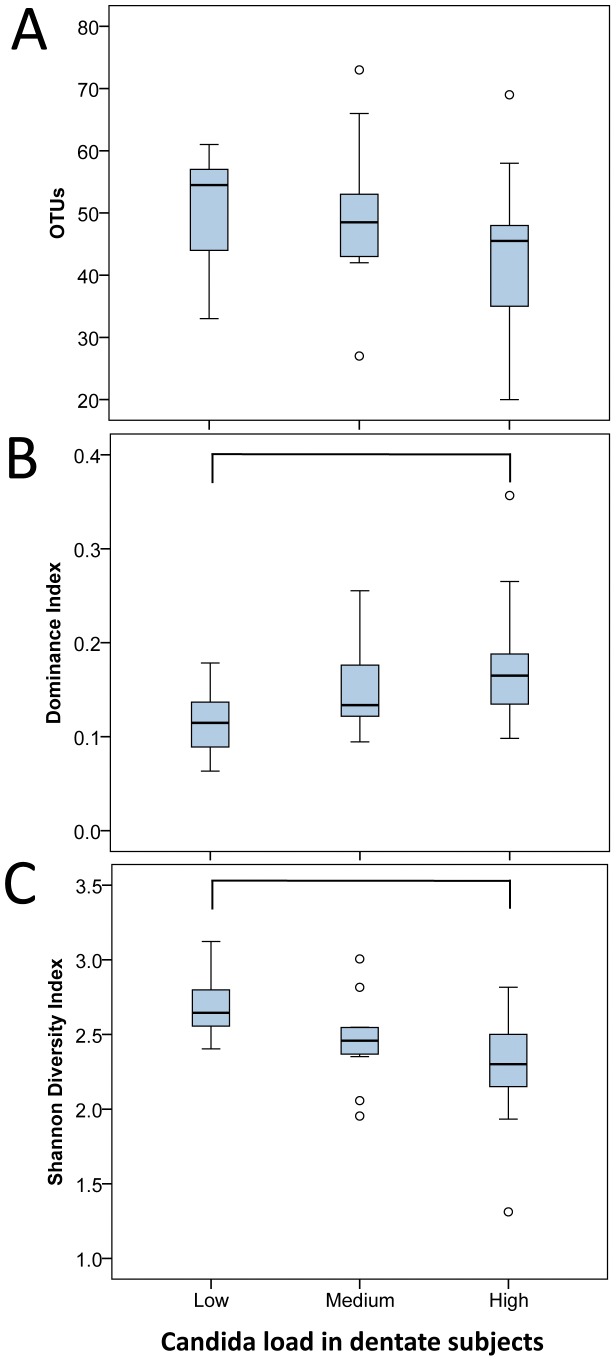
Figure 4. Diversity statistics by Candida load in dentate subjects.
Diversity statistics by Candida load (low (N = 8), medium (N = 12), high (N = 14)) in dentate subjects as boxplots of: A) OTUs per sample, B) Dominance Index and C) Shannon Diversity Index. Each box shows the median, quartiles, and outliers (circles). Connector connects statistically significantly different groups (p<0.05; Mann-Whitney test).

