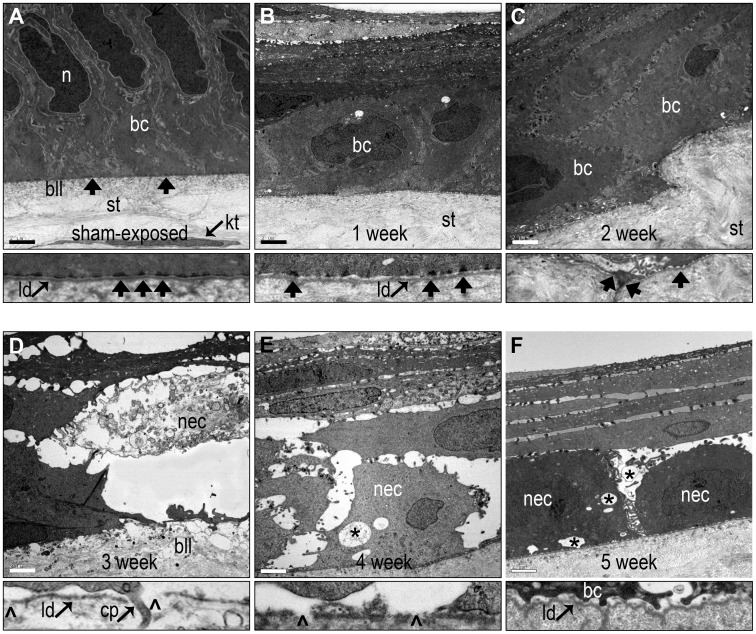
Figure 4. Changes in the ultrastructure of the BMZ from 1–5 weeks during the onset of MGK.
(A–F) TEM images from control and 1–5 weeks. Scale bar = 2 µm. Thin panels represent high magnification images of the BMZ. Basal cell (bc); hemidesmosomes (arrows); nucleus (n); stroma (st); Bowman’s like-layer (bll); necrotic basal cell (nec); proteinaceous void (*); lamina densa (ld); epithelial process penetrating into stroma (c); and breaks in the lamina densa (arrowheads).

