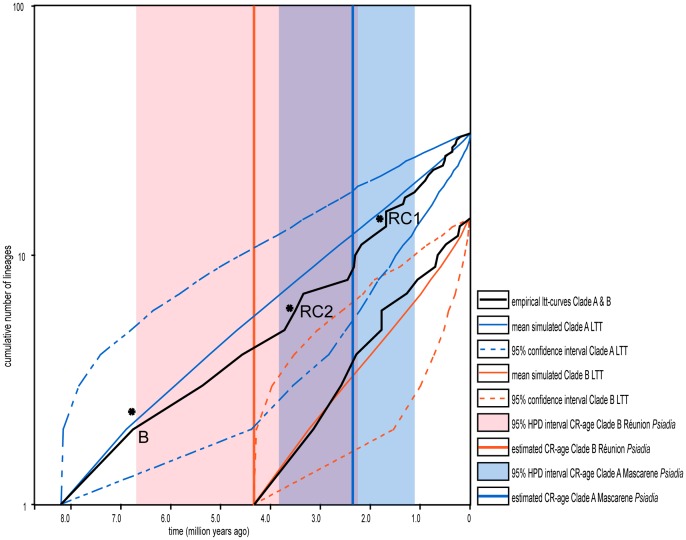
Figure 4. Lineage through time curves (with 95% confidence intervals) for clades A and B.
Black lines: individual empirical curves from the BEAST analysis. Blue (clade A) and red (clade B) lines demarcate 95% confidence intervals generated using a constant rates model. Included rate shifts (*) and 95% HPD intervals shown as described in text and Figure 3.

