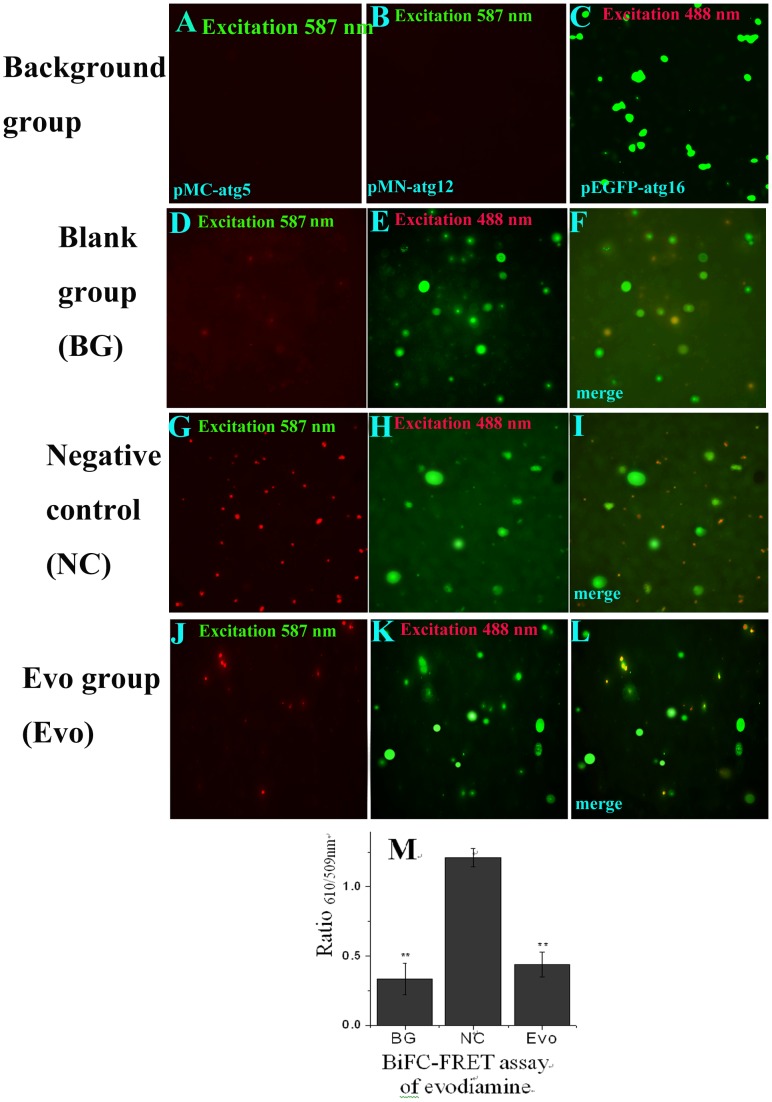
Figure 1. Evodiamine inhibits the interaction of Atg5, Atg12 and Atg16 determined by the BiFC-FRET assay.
(A, B) The A549 cells were transfected with pMC-atg5 or pMN-atg12, respectively. (C) The A549 cells were transfected with the pEGFP-atg16 plasmid and treated with evodiamine (12.5 µg/mL). (D–L) The BiFC-FRET assay of evodiamine, the A549 cells in all groups were cotransfected with the pMC-atg5, pMN-atg12 and pEGFP-atg16 plasmids. In the BG group, the cells were not infected and not treated with drugs. In NC and Evo groups, the cells were infected (MOI = 2.0), and at the same time treated without or with evodiamine (12.5 µg/mL) for 8 h, respectively. The graphs were obtained using an upright fluorescence microscope (10×40). The D, G and J graphs were obtained after excitation at 587 nm to show the BiFC signal between atg5 and atg12. The E, H and K graphs were obtained after excitation at 488 nm, but the FRET signal was determined at 610 nm and 509 nm after excitation at 488 nm using a microplate reader, and the result of FRET assay was shown in (M). The F, I and L showed the colocalization of atg5, atg12 and atg16. Data shown were the mean±SD of two independent experiments with three replicates. *P<0.05, **P<0.001, vs. the NC.

