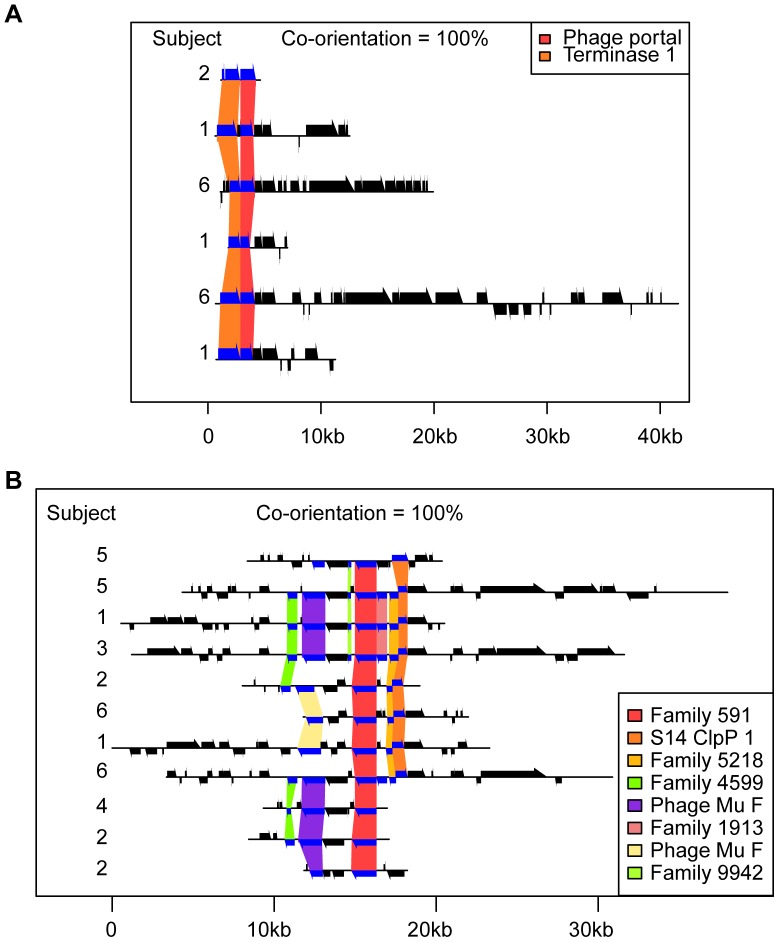
Figure 4. Two examples of phage cassettes.
Contigs are shown as horizontal black lines, ORFs on those contigs are shown by black arrows above and below those lines, and the organization of those ORFs into protein-coding families is shown with colored boxes. The subject that each contig was assembled from is shown on the left of each panel. When a protein-coding family was functionally annotated according to its similarity with the CDD, that annotation is listed in the legend. Otherwise a unique identification number is shown (e. g. Family 591). The co-orientation score describes the proportion of gene pairs that, when occurring together on multiple contigs, do so in the same relative orientation.

