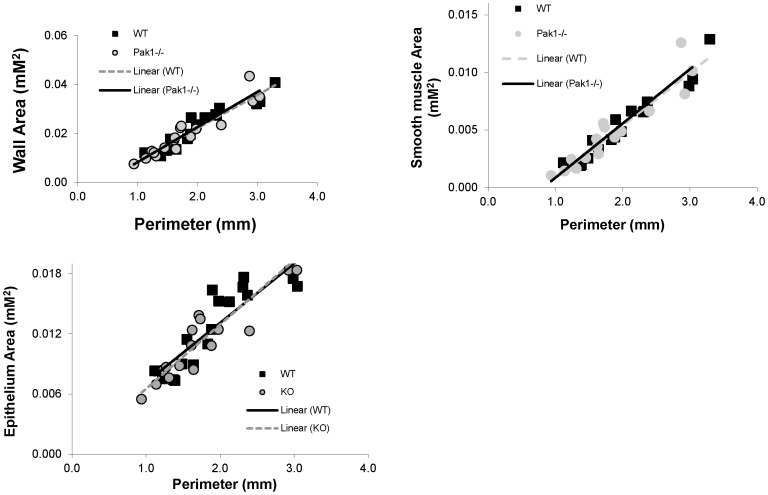
Figure 6. Comparison of Lung Histology for WT and Pak1 −/− mice.
Airway wall area (A), airway smooth muscle area (B), and airway epithelium area (C) were not significantly different between the WT (black squares) and Pak1 −/− (grey circles) mice when assessed by ANOVA adjusting for airway perimeter (p>0.15). (N = 5 mice in each group).

