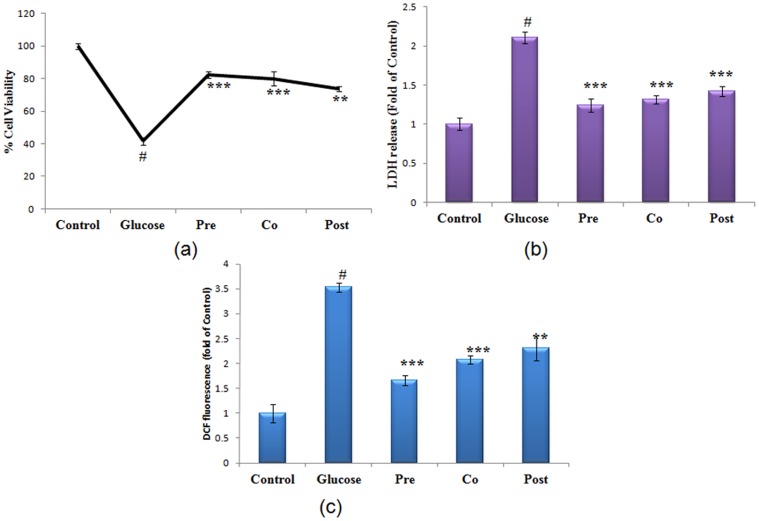
Figure 1. Protection accorded by morin during high glucose cytotoxicity.
(a) Effect of morin on cell viability of glucose stressed primary hepatocytes as assessed by Alamar Blue. Relative viability is shown as the percentage of viable cells compared to control. (b) LDH release was assessed in control, high glucose treated (40 mM) and morin treated (pre, co and post-treated) stressed cells, expressed as the fold change compared to untreated cells. (c) ROS generation assessed by spectrofluorometry using fluoroprobe DCFH-DA. Results are represented as fold of DCF fluorescence as compared to control during increasing concentration of glucose. Results are shown as mean ± S.E. # denotes significant difference compared with control values. *P<0.05, **P<0.01 and ***P<0.001 denotes significant difference compared with 40 mM glucose treated cells. Results are representative of three separate experiments. The S.D. was below ±5% in all cases.

