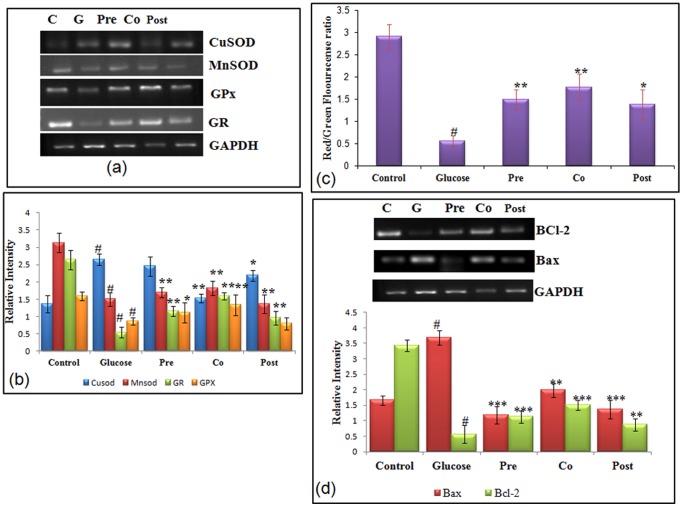
Figure 2. Effect of morin on antioxidant status, MMP and transcriptional level of Bax and Bcl-2.
(a) Transcriptional level of antioxidant genes. m-RNA of MnSOD, Cu Zn-SOD, GPx and GR were amplified by RT-PCR and analyzed by electrophoresis on 1.8% agarose gel and ethidium bromide staining. GAPDH was used as internal control. (b) Bar graphs show fold change in expression of MnSOD, Cu Zn-SOD, GPx and GR. (c) Induction of mitochondrial membrane collapse in hepatocytes cultured with high glucose. MMP was assessed in control, high glucose treated (40 mM) and morin treated (pre, co and post-treated) stressed cells. Mitochondrial membrane potential of treated and control cells was assessed by fluorescent spectrophotometer using JC-1. Decrease in the red (polarized)/green (depolarized) fluorescence ratio reflects increased number of depolarized mitochondria. (d) m-RNA level of Bcl-2 and Bax, were amplified by RT-PCR and analyzed by 1.8% agarose gel electrophoresis followed by ethidium bromide staining. GAPDH was used as internal control. Graph shows fold change in m-RNA level. Results are shown as mean ± S.E. # denotes significant difference compared with control values and *P<0.05, **P<0.01 and ***P<0.001 denotes significant difference compared with 40 mM glucose.

