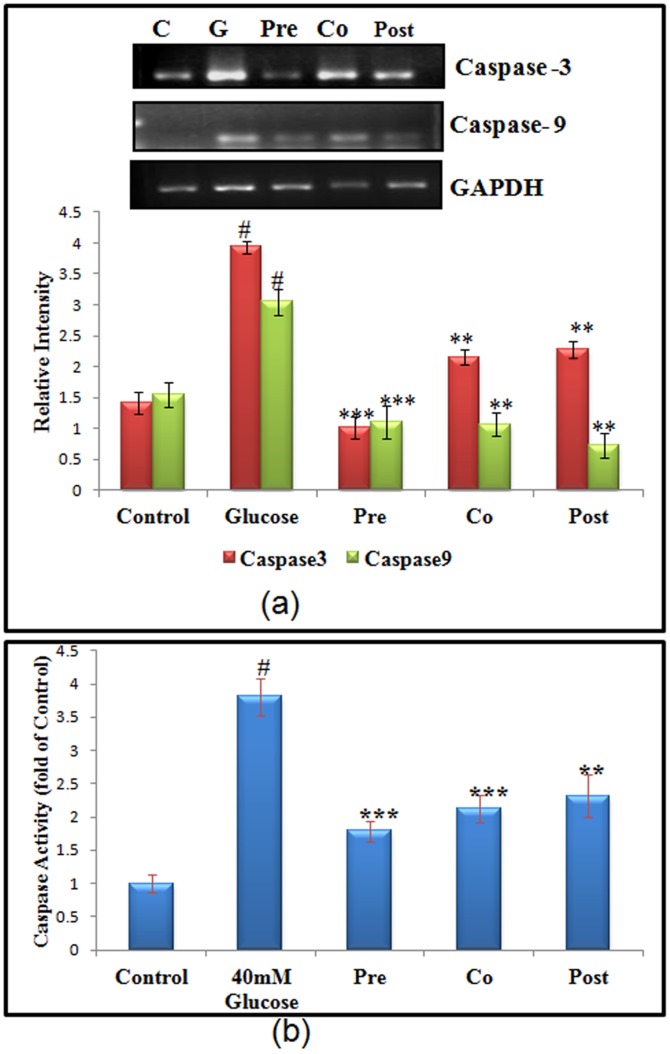
Figure 4. Effect of morin on m-RNA level of apoptotic genes.
(a) m-RNA level of apoptotic genes such as caspase-3 and caspase-9 were amplified by RT-PCR and analyzed by 1.8% agarose gel electrophoresis followed by ethidium bromide staining. GAPDH was used as internal control. Graph shows fold change in m-RNA level. (b) Caspase -3 enzymatic activity of control and stressed cells. Results are shown as mean ± S.E. # denotes significant difference compared with control values and *P<0.05, **P<0.01 and ***P<0.001 denotes significant difference compared with 40 mM glucose.

