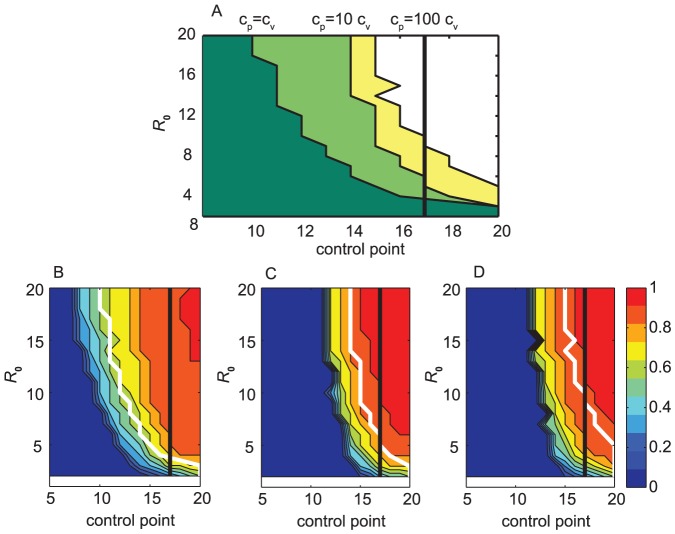
Figure 4. Optimal strategies over a range of .
 values. (A) The time in the outbreak when the strategy should be switched from vaccine-only to a palliative-care-only strategy, for 3 ratios of costs of unit palliative care and unit vaccine: 1, 10, 100 (curves from left to right, dark green, light green, and yellow, respectively). Time is rescaled to epidemic time (in relation to the duration of the epidemic that changes with
  ) so that outbreaks for all values of
  peak along the vertical black line. (B)–(D) Best performing strategy over a range of
  values and different times of control. The colorbar shows the proportion of the budget invested in palliative care; 0 (dark blue) is vaccination-only strategy, 1 (dark red) is palliative-care-only strategy. Red colors correspond to palliative-care-intense strategies, and strategies in the blue region focus on vaccination. Time is rescaled to the epidemic so that for all
  values the epidemic peaks along the black line. The white line shows the time at which one should switch from a vaccine-only to a palliative-care-only strategy in (A). In (B) the cost of per unit palliative care (
 ) is equal to per unit cost of vaccine (
 ),
),  =
=  ; (C)
; (C)  = 10
= 10  ; (D)
; (D)  = 100
= 100  . Limited budget (100000 cost units). Outbreak alert threshold is set to 10 cases. Parameters:
  ,
,  and
and  are varied according to
  such that
  ,
,  days,
days,  days,
days,  days,
days,  year−1,
  ,
,  ,
,  .
.

