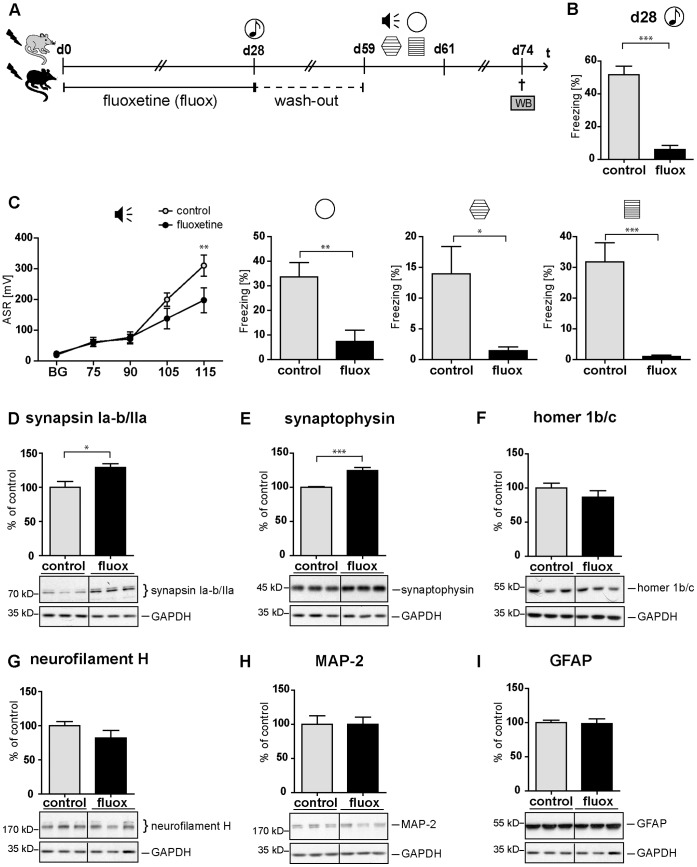
Figure 6. Chronic fluoxetine treatment counteracts both the PTSD-like syndrome and the accompanying hippocampal SV protein reduction.
(A) Course of experiment: C57BL/6 NCrl mice (batch PTSD IV) were exposed to a single electric footshock and subsequently subjected to treatment with either fluoxetine (20 mg/kg/d) or, for control, drinking water. On day 28, their generalized fear response was assessed (B) during the presentation of a neutral tone in the neutral context (t = 7.516, df = 28, p<0.001). Figure S1 provides further details of behavioral protocols. The following 3 days, the dose of fluoxetine was halved (i.e. 10 mg/kg/d) prior to subsequent treatment interruption. After a 4-week washout period, mice were tested on days 59–61 for the intensities of (C) their acoustic startle response (F1,112 fluoxetine = 2.072, p = 0.161; F4,112 INT x fluoxetine = 4.325, p = 0.003), generalized fear response (t (28) = 3.475, p = 0.002), t (28) = 2.607, p = 0.015) and conditioned fear response (t (23) = 4.736, p<0.001). Presented data are means ± SEM, n = 16 (ctrl), n = 14 (fluox). (D–I) Representative immunoblots of all candidate proteins and, for control, glycerinaldehyd-3-phosphat-dehydrogenase (GAPDH) analyzed in tissue lysates prepared on day 74 after footshock or control treatment from pooled bilateral hippocampus of footshocked control (ctrl) or footshocked fluoxetine (fluox) treated mice, respectively. Grouped graphical inserts belong to one and the same gel. Graphs show relative expression levels of synapsin Ia–b/IIa (D), synaptophysin (E), homer 1b/c (F), neurofilament (G), MAP-2 (H), and GFAP (I) after normalization to GAPDH. Candidate protein expression levels assessed in fluoxetine-treated mice are presented as percent of those of control mice set at 100% (% of control). Plotted data represent means ± SEM, n = 6. Statistical significance was calculated using students t-test and is indicated by * p<0.05, ** p<0.01, *** p<0.001. (synapsin Ia–b/IIa: t (10) = 2.929, p = 0.015; synaptophysin: t (10) = 5.239, p<0.001; homer 1b/c: t (10) = 1.150, p = 0.277; neurofilament H: t (10) = 1.433, p = 0.182; MAP-2: t (10) = 0.007, p = 0.995; GFAP: t (10) = 0.139, p = 0.892).

