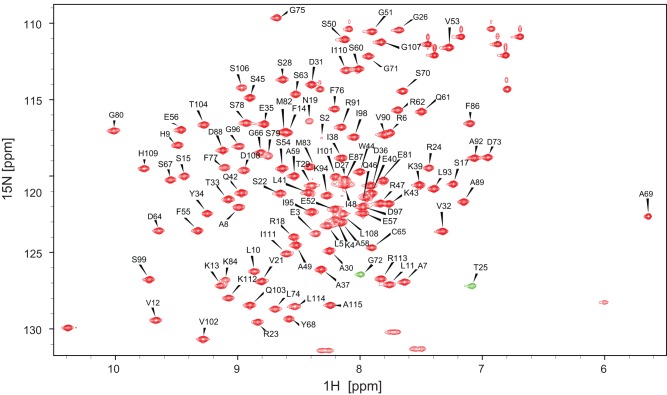
Figure 2. Assigned 1H-15N HSQC spectrum of TbPin1 in 20 mM sodium phosphate buffer at pH 7.0.
The spectrum was recorded at 298 K on a Varian Unity Inova 600 MHz spectrometer. Resonance assignments of backbone amide groups are indicated by the residue type and number. The unlabeled resonances are the side chain amides. T25 and G72 are shown in negative resonances corresponding to the resonances aliased in the 15N dimension. Positive resonances are colored red and negative resonances are colored green.

