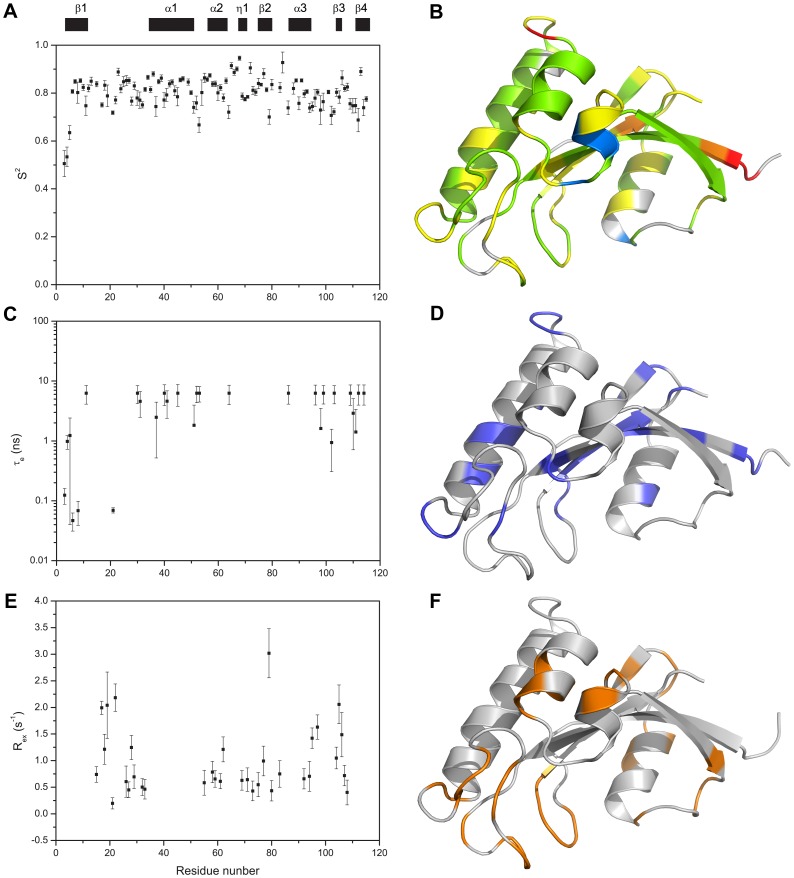
Figure 8. Model-free analysis of TbPin1.
(A, C and E) The plots of the order parameters S2, the effective internal correlation time τe, and the conformational exchange rate Rex versus residue number of TbPin1, respectively; (B, D and F) Residues with S2, τe (blue) and Rex (orange) values are mapped onto the solution structure of TbPin1, respectively. (B) Gray, S2 unavailable due to the absence of NMR data or failure in NMR data fitting; red, S2<0.6; orange, 0.6≤S2<0.7; yellow, 0.7≤S2<0.8; green, 0.8≤S2<0.9; and blue, 0.9≤S2<1.0. The ribbon graph was generated by PyMOL.

