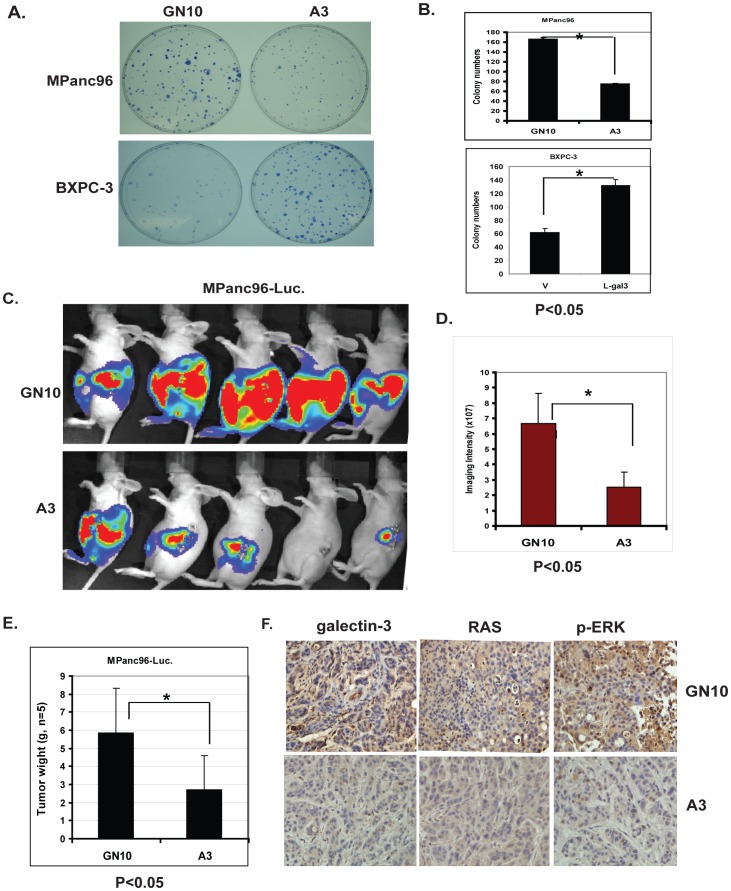
Figure 4. Effects of Gal-3 on PDAC cell colony formation and the growth of PDAC tumor in vivo.
A. Colony formation assays were performed in MPanc96 GN10 control cells and Gal-3 shRNA knock down A3 cells (top panel) or BXPC-3 V control cells and BXPC-3 Gal3 cDNA overexpressed L-gal3 cells (lower panel) as described in Materials and Methods. MPanc96-A3 cells formed smaller and fewer colonies compared with the vector transfected control cells (GN10). In contrast, BXPC-3 L-gal3 cells formed larger and a greater number of colonies than control V cells. B. Bar graph in the right panel demonstrates the mean colony numbers after plating either MPanc96 GN10 control cells and shRNA knock down A3 cells (top) or BXPC-3 V and BXPC-3 L-gal3 (lower); p<0.001. C. Representative bioluminescence images of athymic mice 3 weeks after orthotopic implantation of GN10 and A3 pancreatic cancer cells orthotopically into the pancreas of athymic mice. D. Measurements of photons/s/cm2/steridian depicting bioluminescence area at 10% peak margin (mean ± SE) at week 3 using Xenogen IVIS as described in Materials and Methods (n = 5). E. Tumor weights from control mice (GN10, n = 5) and Gal3 knockdown group (A3, n = 5) were weighted after mice were sacrifice at week four. F. Mouse tumor tissues from control (GN10) and Gal-3 knockdown group (A3) were immunohistochemically stained using Gal-3, Ras and phospho-ERK antibodies as described in Materials and Methods.

