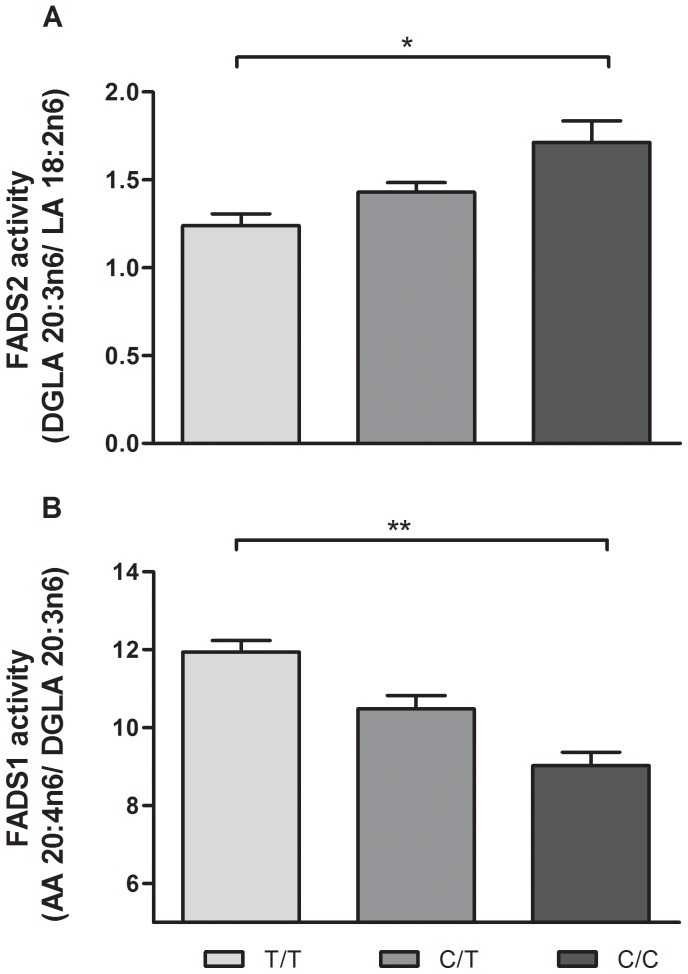
Figure 6. desaturation indices by rs174555 genotype.
FADS desaturase activity shows an allele dosage dependent pattern. Following correction for multiple testing homozygous minor were significantly different compared to homozygous major (Sample size after outlier removal: FADS 2 activity N = 30, 21, 10; FADS 1 activity 30, 21, 9; *p<0.05).

