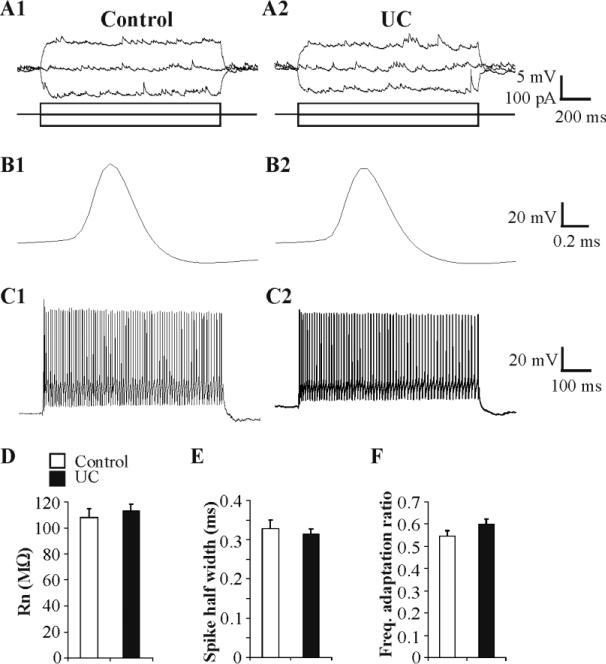
Fig. 3. Membrane properties of FS cells in control and UC slices.
A: Representative current clamp responses of FS cells in control (A1) and UC groups (A2) to direct current injection (lower traces). B: Initial action potentials in trains from control (B1) and UC (B2) FS cells have similar spike half width. C: Spike trains (~110 Hz) evoked by 600 ms current pulses in representative control (C1, Vm -69 mV) and UC (C2, Vm -65 mV) FS cells. D-F: Bar graphs of input resistance (D; Rn), spike half width (E) and frequency adaptation ratio (ratio of the average frequency of last 5 APs to that of the initial 2 spikes in a 600ms train with firing frequency of ~110 Hz (F) in control (n = 29) and UC (n = 40) groups.

