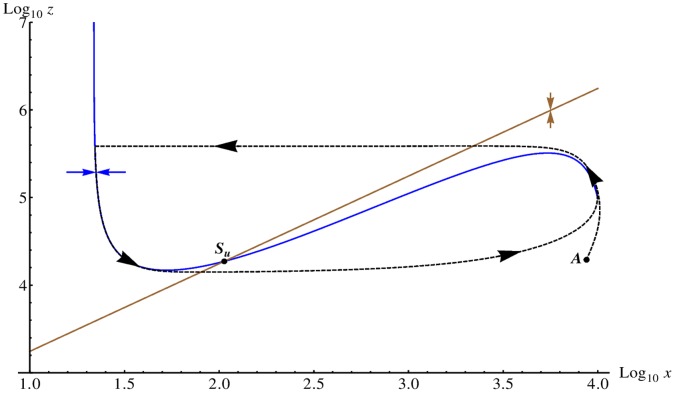
Figure 3. Nullclines in the Oregonator model.
We display the nullclines (logarithmic scale) of the activator species  (blue curve) and the inhibitor
  (brown curve) for the Oregonator model in the deterministic limit for the parameter set given in Table 6 and
  . We assume that the intermediary species
  is in a steady-state equilibrium with
  and
and  and ignore diffusion. The blue (brown) arrow illustrates the gradient in phase space of the activator (inhibitor) on either side of the nullcline and the unstable fix point is marked with
  . The system is in the unstable (oscillatory) regime. We plot an example trajectory (dashed curve) of a larger perturbation from the (linearly stable) trivial homogeneous state. Starting at point
  , the system enters a limit cycle in phase space.

