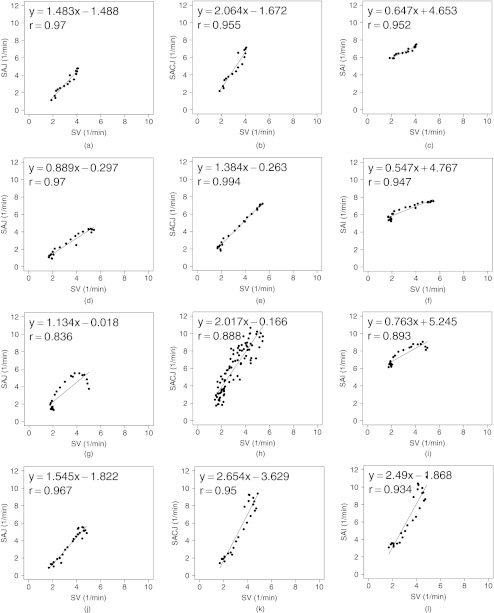
Figure 10.
Large slab ROIs with size 150 mm × 8 mm × 40 mm results for registration estimated ventilation measures compared to the Xe-CT estimated ventilation sV in scatter plot with linear regression in four animals. The first column is the SAJ vs sV. The second column is the SACJ vs sV. The third column is the SAI vs sV.

