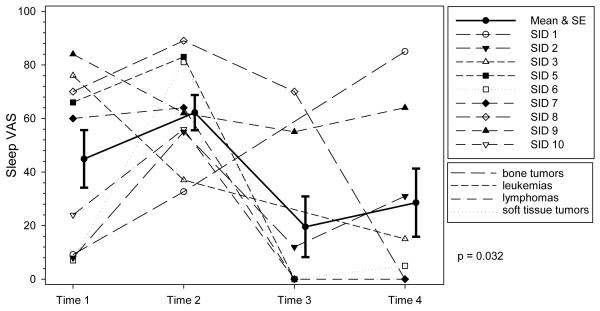
Figure 2. Profile Plot of Severity of Difficulty Sleeping by Diagnosis over Time.
Individual ratings of severity of difficulty sleeping at each time point. VAS indicates Visual Analog Scale. The solid line represents the mean severity scores of difficulty sleeping and the error bars represent ± 1 standard error. The trajectory of difficulty sleeping was significant indicating mean scores changed over time.

