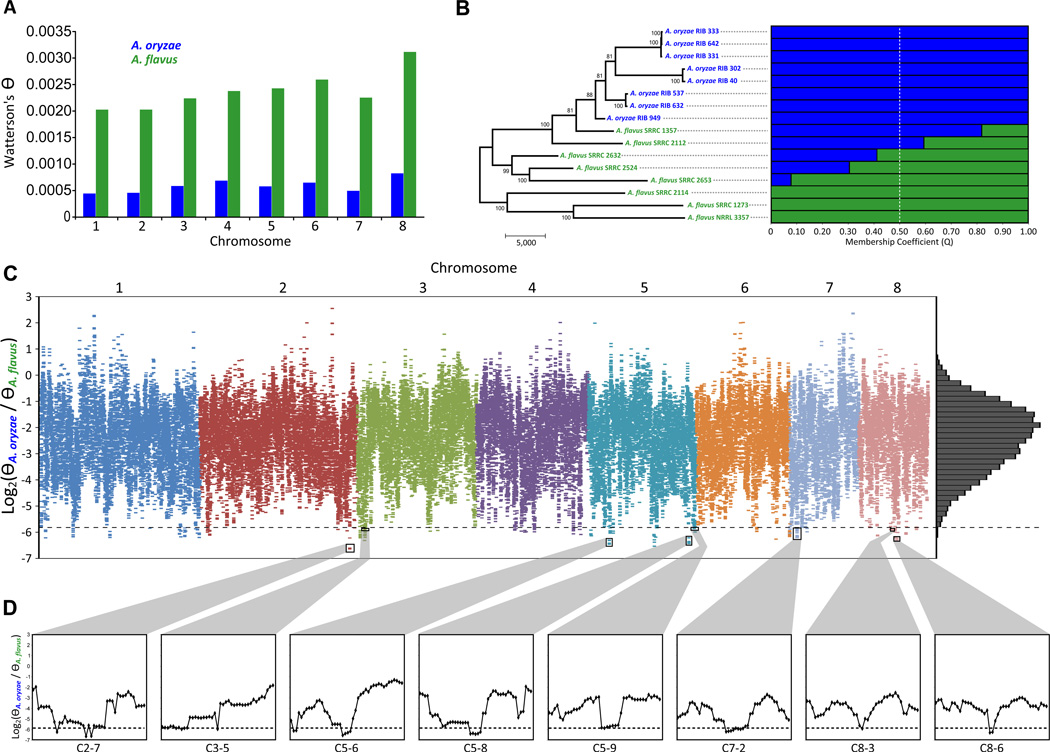
Figure 1. Phylogenetic relationship and genomic patterns of variation in A. oryzae and A. flavus.
(A) Chromosomal levels of nucleotide variation (Θ) in A. oryzae (blue) and A. flavus (green). (B) Left panel: Parsimony-inferred phylogeny of the 16 A. oryzae (blue) and A. flavus (green) isolates from the 100,084 high quality genome-wide variant sites. Values near internodes indicate bootstrap support, generated by 1,000 replicates. The scale bar represents the number of changes. Right panel: structure-based membership coefficient for each isolate (population number K = 2). The A. oryzae and A. flavus genetic backgrounds are shown in blue and green, respectively. (C) Relative nucleotide diversity scores (ΘOF) for 5-kb windows (65,894 windows) with a 500 bp step size scanning the eight chromosomes. Points below the dotted line represent genomic regions below the empirical 0.25% quantile (164 windows) and comprise the candidate Putative Selective Sweep Regions (PSSRs). The right panel shows the distribution of ΘOF scores. (D) Close-ups of representative PSSRs and flanking regions.

