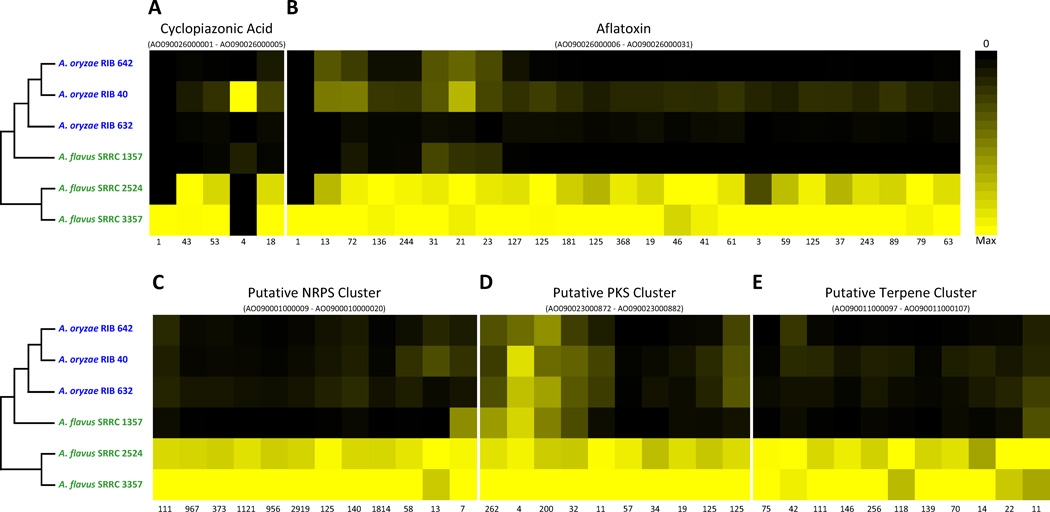
Figure 4. The A. oryzae secondary metabolism transcriptome is widely down-regulated during growth on rice.
Expression levels of five down-regulated secondary metabolism biosynthesis gene clusters for the six isolates for: (A) cyclopiazonic acid, (B) aflatoxin, (C) putative nonribosomal peptide metabolite, (D) putative polyketide synthase metabolite, and (E) putative terpene. The range of genes included in each gene clusters is given under each cluster’s name. For each gene, the color of the heat map cell corresponds to its expression level (in RPKM units), where black is zero expression and yellow is the maximum RPKM for that gene (listed below each gene).

