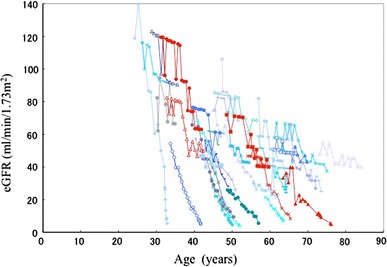
Fig. 4.

eGFR changes in patients followed for more than 5 years (n = 36). In 5 patients shown by a red line, the declining curve changed from moderate to rapid during follow up. The change points varied in relation to age or eGFR level. Other patients are shown in blue for easy identification
